
![You are currently viewing
<span class="bsf-rt-reading-time"><span class="bsf-rt-display-label" prefix="Reading Time"></span> <span class="bsf-rt-display-time" reading_time="6"></span> <span class="bsf-rt-display-postfix" postfix="mins"></span></span><!-- .bsf-rt-reading-time -->How to Trade Diamond Chart Patterns Like a Pro [2024]](https://bullsarenatrading.com/wp-content/uploads/2022/11/how-to-trade-diamond-pattern.webp)
In the dynamic world of trading, success hinges on your ability to decipher the intricate language of charts and patterns. Among the myriad of tools at a trader’s disposal, The “Diamond Chart Pattern” stands as a beacon of insight into market movements.
In this comprehensive guide, we delve deep into the realm of Diamond Chart Patterns, a powerful asset for traders seeking to enhance their efficiency and profitability. So, if you’ve ever found yourself grappling with the complexities of trading, wondering how to navigate the tumultuous waters of financial markets, you’re in the right place. We’ll not only unravel the mysteries of this pattern but also provide you with invaluable insights, strategies, and techniques to elevate your trading game.
Are you ready to unlock the potential of Diamond Chart Patterns and steer your trading journey toward success?
Let’s dive in. As Warren Buffett wisely puts it, “The stock market is designed to transfer money from the Active to the Patient.”
Table of Contents
- 1. What Is a Diamond Chart Pattern?
- 2. How To Identify Diamond Chart Pattern
- 3. Types of Diamond Chart Patterns
- 4. Spotting Diamond Patterns in Real Charts
- 5. Trading Strategies with Diamond Chart Patterns
- 6. Performance Matrix for Diamond Pattern
- 7. Risk Management and Stop Loss
- 8. Common Mistakes to Avoid
- 9. Best Tips For Trading Diamond Chart Pattern
- Conclusion
1. What Is a Diamond Chart Pattern?
A Diamond Chart Pattern, also known as a Diamond Top or Diamond Bottom, is a formation that occurs after a significant price movement. It signifies a period of consolidation and indecision in the market, hinting at a potential trend reversal or continuation.
Although some traders also employ the diamond top and bottom chart patterns as reversal patterns, Thomas N. Bulowski’s research indicates that these patterns perform better when used as continuation signals.

Key Characteristics of a Diamond Chart Pattern
- Symmetry: The Diamond pattern is characterized by two converging trendlines, forming a diamond shape. This symmetrical structure is a defining feature of the pattern.
- Duration: The consolidation period within a Diamond pattern can vary, making it essential to recognize both short-term and longer-term variations.
- Breakout Direction: The breakout from a Diamond pattern can occur in either a bullish (upward) or bearish (downward) direction, offering opportunities for both trend-following and contrarian traders.
2. How To Identify Diamond Chart Pattern
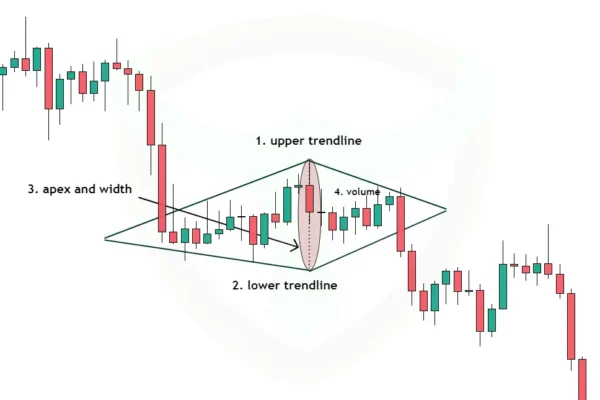
To understand this pattern better, we need to grasp its six crucial elements:
- The Upper Trendline
This line connects the descending highs, forming the upper boundary of the diamond. It represents the resistance level that traders should watch closely.
- The Lower Trendline
Conversely, the lower trendline connects the ascending lows, forming the lower boundary of the diamond. It acts as a support level for the price.
- The Apex
The apex is the point where the upper and lower trend lines intersect. It signifies a potential turning point in the price trend.
- The Width
The width of the diamond, measured from the widest point, provides insight into the duration of the pattern and the potential price movement.
- Volume Trend
Volume is high at the start of the diamond chart pattern and decreases during the second half of the formation.
- Breakout Direction
Generally the breakout is in the direction of prior trend, however study has shown that the failed breakouts result is short term bullish or bearish reversals
3. Types of Diamond Chart Patterns
Diamond Chart Patterns come in various forms, each with its unique characteristics. Let’s explore the most common types:
Symmetrical Diamond
A symmetrical diamond pattern occurs when the upper and lower trendlines have a similar slope. This suggests a period of consolidation and uncertainty, where the market is undecided about its next move.

Ascending Diamond
In an ascending diamond, the upper trendline has a steeper slope than the lower trendline. This pattern often indicates a bullish bias, with a higher probability of an upward breakout.
Descending Diamond
Conversely, the descending diamond has a lower trendline with a steeper slope. This pattern leans towards bearishness, with a higher likelihood of a downward breakout.

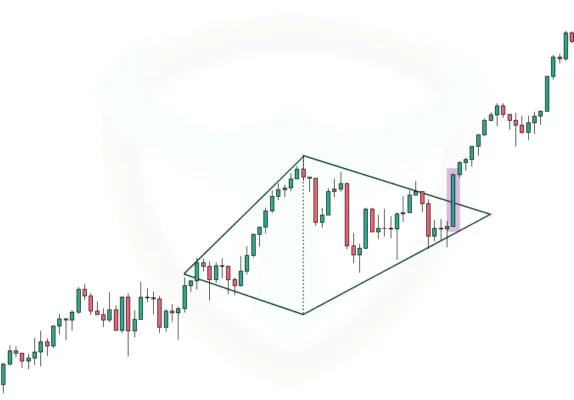
4. Spotting Diamond Patterns in Real Charts
Identifying Diamond Chart Patterns in real charts is a crucial skill for traders. Here’s how you can spot them:
Using Technical Analysis Tools
Technical analysis tools such as trend lines, moving averages, and chart patterns recognition software can help in identifying diamond patterns efficiently.
Recognizing the Trend Potential
Understanding the context of the pattern within the broader market trend is essential. Diamond patterns often signal potential trend movement, so be vigilant when they appear.

5. Trading Strategies with Diamond Chart Patterns
Now that we’ve identified and understood diamond patterns let’s explore some effective trading strategies associated with them.
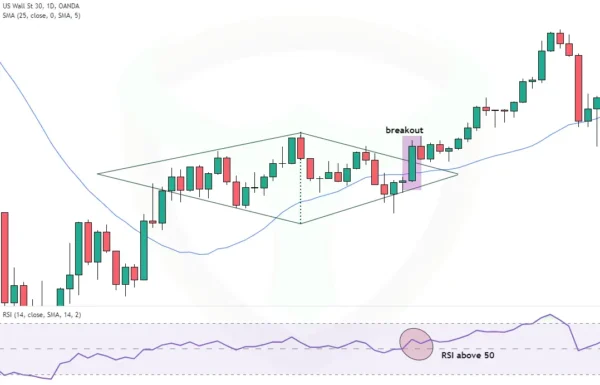
Breakout Trading
One common strategy is to enter a trade when the price breaks out of the diamond pattern. This can be a powerful move, but it’s essential to wait for confirmation.

Confirmation Indicators
To increase the reliability of your trades, consider using confirmation indicators such as moving averages, the Relative Strength Index (RSI), and volume analysis.

6. Performance Matrix for Diamond Pattern
Diamond chart pattern performance matrix table is given below to study how diamond chart pattern has performed on various parameters-
| Bull Market Performance | 70% continuation, 30% reversal rate |
| Bear Market Performance | 63% Continuation, 37% reversal |
| % Gain | 27% in uptrend, 33% downtrend |
| Diamond Top breakout pullback % | 59% |
| Diamond Bottom breakout pullback % | 54% |
| Diamond Top average formation length | 46 days |
| Diamond bottom average formation length | 54 days |
| Tall pattern performance | 31% |
| Narrow pattern performance | 29% |
| Wide pattern performance | 33% |
7. Risk Management and Stop Loss
While diamond patterns offer potential profit opportunities, they also come with risks. Here’s how to manage them:

Setting Stop Loss Levels
Always set clear stop-loss levels to limit potential losses in case the price doesn’t move as anticipated.
Position Sizing
Calculate your position size carefully to ensure you’re not risking more than you can afford to lose.
Risk-Reward Ratio
Maintain a favorable risk-reward ratio (1:3 / 1:2), aiming for potential profits that outweigh potential losses.
8. Common Mistakes to Avoid
Trading based on Diamond Chart Patterns can be highly rewarding, but it’s not without its challenges. Here are some common pitfalls to avoid:
Overtrading
Don’t become overly excited and overtrade based solely on the pattern. Patience and confirmation are key.
Ignoring Confirmation Signals
Failing to wait for confirmation before entering a trade can lead to false signals and losses.
Neglecting Overall Market Trends
Remember that the broader market context can significantly impact the outcome of diamond patterns. Don’t disregard it.
9. Best Tips For Trading Diamond Chart Pattern
- Don’t trade diamond chart pattern if the identification is not very clear.
- Failed breakout should be traded as reversal signals.
- Wait for nearby support and resistance to test before placing a trade.
- Tall patterns have good risk to reward and generally perform better than the short ones
- Avoid trading breakouts with gaps, more often these gaps are filled withing 2 or three days.
- Patterns with light breakout volume perform well.
- Diamond chart patterns during trading range should be avoided.
- If breakout level is also a Fibonacci level wait for retest and closely look for a doji / hammer candlestick for a reliable signal before placing entry.
- Diamond chart patterns perform well in both bullish and bearish markets, however diamond tops have higher win rate but diamond tops have good returns.
- Look for other price action trading formations along with diamond chart pattern for extra confluence.
Conclusion
In conclusion, the Diamond Chart Pattern is a valuable tool for traders and investors. By mastering its intricacies, recognizing its types, and employing sound trading strategies, you can harness its potential for profitable ventures. However, always remember the importance of risk management and remain cautious in your trading endeavors. Continuous learning and practice are your allies on this exciting journey through the world of chart patterns.
Note: Always conduct thorough research and consider seeking advice from financial professionals before making any investment decisions. This article is for educational purposes only and should not be construed as financial advice.
Q1: What is a Diamond Chart Pattern?
A Diamond Chart Pattern is a technical analysis pattern in the world of trading. It resembles the shape of a diamond and is formed when there is a consolidation of price movements, indicating potential future trends.
Q2: How can Diamond Chart Patterns improve my trading efficiency?
Diamond Chart Patterns provide valuable insights into market trends and potential price movements. By understanding and utilizing these patterns, you can make more informed trading decisions and increase your chances of success.
Q3: Are Diamond Chart Patterns suitable for all types of trading?
Yes, Diamond Chart Patterns can be applied to various trading styles, including stocks, forex, and commodities. They are versatile tools that can benefit traders in different markets.
Q4: Can I apply Diamond Chart Patterns to day trading or long-term investing?
Yes, Diamond Chart Patterns can be applied to both short-term and long-term trading strategies. You can adapt your approach based on your trading goals and time horizon.
Q5: How often do Diamond Chart Patterns occur in the market?
Diamond Chart Patterns can occur at various frequencies, depending on market conditions. Some traders may encounter them more frequently than others. Our guide will help you identify and trade them effectively.
Q6: Where can I access more resources on Diamond Chart Patterns?
In addition to our guide, you can explore further resources, books, and online courses to deepen your knowledge of Diamond Chart Patterns and trading strategies.
Author


![Read more about the article
<span class="bsf-rt-reading-time"><span class="bsf-rt-display-label" prefix="Reading Time"></span> <span class="bsf-rt-display-time" reading_time="5"></span> <span class="bsf-rt-display-postfix" postfix="mins"></span></span><!-- .bsf-rt-reading-time -->Horn Chart Patterns – Useful Profitable Bar Patterns [2024]](https://bullsarenatrading.com/wp-content/uploads/2022/08/Horn-chart-patterns-Detailed-Trading-Guide-300x225.webp)

