The double top pattern is a popular chart pattern used by technical analysts to identify potential reversals in a security’s price trend. It typically occurs when the price rises to a certain level, retreats, and then retests that level before declining further. But the key question is, does this pattern signal a bullish or bearish trend?
Understanding the implications of a double top pattern is essential for traders and investors looking to make informed decisions. In this article, we will delve into the mechanics of the double top pattern and explore its significance in predicting market direction.
Table of Contents
- What is the double top pattern?
- Identifying the double top pattern
- Characteristics of a double top pattern
- 1. Double top pattern in a bullish market
- 2. Double top pattern in a bearish market
- Trading strategies for the double top pattern
- Common mistakes to avoid when trading the double top pattern
- Double top pattern vs other chart patterns
- Examples of the double top pattern in real market scenarios
- Double Top Pattern Trading Psychology
- What does the triple top pattern mean?
- Conclusion
- Key Takeaways
By recognizing the formation and interpretation of this pattern, traders can gain insights into possible trend reversals and adjust their strategies accordingly. We will explore the factors that contribute to the pattern’s validity, such as volume, timing, and price behavior.
From a bullish or bearish perspective, knowing when a double top pattern confirms a bearish trend reversal or fails to do so is crucial. We will examine the indicators and signals that complement this pattern, helping readers determine the likely outcome in different situations.
Whether you are a seasoned trader or a beginner, understanding the double top pattern is a valuable tool in your technical analysis arsenal. So, let’s dive in and uncover the secrets behind this chart formation.
What is the double top pattern?
The double top pattern is a bearish reversal pattern that typically occurs after an extended upward trend in a security’s price. The pattern consists of two peaks that reach approximately the same level, forming a resistance level known as the “neckline.” After the second peak, the price falls below the neckline, confirming the pattern and signaling a potential trend reversal.

The double top pattern is a mirror image of the double bottom pattern, which is a bullish reversal pattern. Both patterns are formed by two peaks or troughs, with the second peak or trough failing to break through the previous high or low.
Identifying the double top pattern

Identifying the double top pattern is critical for traders looking to capitalize on potential trend reversals. The pattern is characterized by two peaks that reach approximately the same level, separated by a trough. The neckline is drawn by connecting the troughs, forming a horizontal line that represents the resistance level.
To confirm the pattern, the price must fall below the neckline, indicating a potential trend reversal. It is essential to note that the double top pattern is not confirmed until the price falls below the neckline, and traders should wait for confirmation before taking any action.
Characteristics of a double top pattern
The double top pattern is characterized by specific features that distinguish it from other chart patterns. Firstly, the pattern occurs after an extended upward trend, indicating that the security is overbought and due for a correction. Secondly, the two peaks should reach approximately the same level, forming a resistance level at the neckline. Finally, the pattern should be confirmed by a price decline below the neckline, indicating a potential trend reversal.
1. Double top pattern in a bullish market
In a bullish market, a double top pattern can signal a potential trend reversal. Traders should look for signs that the security is overbought, such as a high Relative Strength Index (RSI) or a high Moving Average Convergence Divergence (MACD) indicator. These indicators can suggest that the security is due for a correction, which could lead to a double top pattern formation.
Traders should also look for confirmation of the pattern, such as a decline in volume and a break below the neckline. If these factors are present, traders may consider opening short positions or selling the security.
2. Double top pattern in a bearish market
In a bearish market, the double top pattern is a powerful indication of a potential trend reversal. Traders should look for signs that the security is oversold, such as a low RSI or MACD indicator. These indicators can suggest that the security is due for a correction, which could lead to a double top pattern formation.
Traders should also look for confirmation of the pattern, such as a decline in volume and a break below the neckline. If these factors are present, traders may consider opening long positions or buying the security.
Trading strategies for the double top pattern
There are several trading strategies that traders can use when trading the double top pattern. One strategy is to wait for confirmation of the pattern before taking any action. Traders should wait for the price to fall below the neckline before opening short positions or selling the security.
Entering the Trade with Precision
Entering the trade at the right moment is crucial for maximizing your potential gains. Here’s a step-by-step guide:
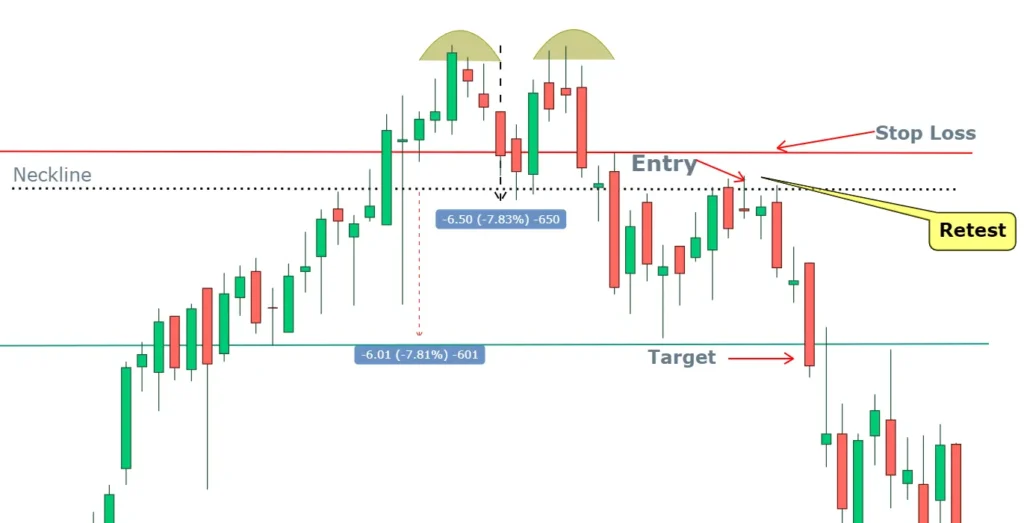
Confirmation is Key: Before entering, ensure that the pattern has confirmed. Confirmation can come in the form of a single candlestick or multiple candlesticks showing rejection of neckline support.
Wait for a Retracement: Prices don’t move in straight lines, and neither should your entry. If prices continue to fall without returning to neckline support, patience is your ally. Wait for a retracement before entering the trade.
Setting Your Stop Loss: Protect your capital with a well-placed stop-loss order. If prices return to neckline resistance, your stop-loss should be set at approximately 1 Average True Range (ATR) above the neckline. ATR is a reliable indicator for gauging market volatility.
Aim for Your Target
Finally, let’s talk targets. Where do you want the trade to take you? There are two common methods:
Width of the Peak: Project the width of the peak downward from the point of entry. This method provides a specific target based on the pattern’s height.
Risk-Reward Ratio: Many traders prefer a risk-reward ratio of 1:3 or more, depending on their trade goals. This means you aim to gain three times what you’re risking. It’s a prudent approach to risk management.
In essence, trading the Double Top Pattern is not just about spotting the formation; it’s about mastering the art of timing, confirmation, and risk management. The market is a dynamic arena, and every decision you make should be backed by a thorough understanding of the pattern and the current market conditions.
Another strategy is to use stop-loss orders to limit potential losses. Traders can place stop-loss orders just above the neckline to limit their losses if the pattern fails to confirm.
Traders can also use other technical indicators, such as the RSI or MACD, to confirm the pattern and inform their trading decisions.
Common mistakes to avoid when trading the double top pattern
One common mistake that traders make when trading the double top pattern is to enter a trade too early. Traders should wait for confirmation of the pattern before taking any action, as a false breakout could lead to significant losses.
Another mistake is to ignore other technical indicators that could confirm or contradict the pattern. Traders should use multiple indicators to inform their trading decisions and avoid relying solely on the double top pattern.
Finally, traders should avoid holding onto losing positions for too long. If the pattern fails to confirm, traders should cut their losses and move on to the next trade.
Double top pattern vs other chart patterns
The double top pattern is just one of several chart patterns used by technical analysts. Other chart patterns include the head and shoulders pattern, the ascending triangle pattern, and the descending triangle pattern.
Each pattern has its own unique characteristics and implications for market direction. Traders should use multiple indicators and chart patterns to inform their trading decisions and avoid relying solely on one pattern.
Examples of the double top pattern in real market scenarios
The double top pattern has appeared in several real market scenarios, providing traders with opportunities to profit from potential trend reversals. One example is the double top pattern that appeared in the S&P 500 index in 2020.

In February 2020, the index reached its highest point. Then, when the COVID-19 pandemic hit, there was a sharp drop in prices. The neckline level was tested once, but prices continued to fall, leading to a new downtrend.
Double Top Pattern Trading Psychology
Have you ever thought🤔 Why does any pattern work?
For many years, traders have used patterns that appear repeatedly.
Why does this symmetry appear in charts? 💹
To find answers to these questions, you must investigate the psychological aspects of markets.
💡Prices are simply a reflection of what the majority of traders believe.
You must understand the reasoning behind it in order to trade this pattern effectively and logically.
So, what are the different phases of pattern formation and what do they mean?
☑️Phase 1:
Prices are in an uptrend, and everyone wants to jump in and join the rally.
☑️Phase 2:
Some of the traders who participated in the very early (beginning of the uptrend) want to book their profit before it is too late. This tendency weakens buying momentum and causes prices to fall until all profits have been booked. Also process is accelerated as a result of many stop loss orders triggering simultaneously for orders placed recently.

☑️Phase 3 :
Once the market has absorbed all of the selling pressure, phase 3 begins, which is buying by those who believe the market is still in an uptrend and the halt in selling gives them confidence to go long. This marks the start of buying until the previous high is reached.
☑️Phase 4:
Keep in mind that at this point, two scenarios are possible, which will determine the next step. The first scenario develops when prices break above the previous high with momentum and more buyers join the uptrend, invalidating the double top pattern and turning it into a bullish continuation pattern. The second scenario develops when the market is unable to push prices higher than the previous high, activating new sellers in anticipation of a reversal. In the second scenario prices move down and confirm phase 4.
☑️Phase 5:
Once the breakout from the neckline occurs, there are two possibilities that will determine whether or not the double top pattern is in place. If prices approach the neckline, which becomes a resistance level, and break through it, going above the neckline invalidates our pattern; however, if prices reject this resistance level and move lower, the double top pattern is confirmed.
☑️Phase 6 :
A confirmed double top pattern lowers prices, and a bearish reversal is said to be in place now. The price move may not be very aggressive, but it is often the beginning of a downtrend.
What does the triple top pattern mean?

The triple top pattern occurrence is very infrequent, but if you know how to trade the double top pattern, trading the triple top pattern will be simple. Since a triple top pattern is similar to a double top pattern, the only difference is one more swing high.
Trade objectives, entry, and exit will be the same as in a double top pattern. It is important to note that the third high formation does not always coincide with the level of the first two swing highs. If the third high formation is slightly below the level of the first two highs, it should be treated as a valid triple top pattern.
Conclusion
The double top pattern is a powerful indication of potential trend reversals in a security’s price. Traders should look for signs of the pattern, such as two peaks that reach approximately the same level and confirmation of the pattern by a decline below the neckline.
Traders should use multiple indicators and chart patterns to inform their trading decisions and avoid relying solely on one pattern. By recognizing the formation and interpretation of the double top pattern, traders can gain insights into possible trend reversals and adjust their strategies accordingly.
Key Takeaways
- The double top pattern is a bearish trend reversal stock chart pattern.
- The double top pattern should be used to identify market trend reversals in the medium to long term.
- Retracement to neckline support after a breakout from the neckline is very common and should always be kept in mind when trading the double top pattern.
- To trade double top patterns with high accuracy, you should always confirm the formation phase of the pattern before entering and always avoid “jumping the gun” error.
- In the case of a double top pattern, the stop loss should be placed 1 ATR above the neckline resistance or above the first rejection after the breakout from the neckline.
- Triple top formations occur infrequently, but when they do, they should be traded similarly to double top patterns.
- Technical analysis of double top & double bottom chart patterns in trading is an effective trading methodology with good risk to reward.
Disclaimer: Trading involves risk, and the information provided in this blog post is for educational purposes only. It should not be considered as financial advice. Always do your own research and consult with a qualified financial advisor before making any trading or investment decisions.
Author is Senior Trading Analyst“In short, we suffer from an “illusion of control” that fools us into thinking the future is more predictable and less uncertain than it really is. Or worse, we believe we can influence chance events through our own actions.”
-Ed Seykota
At Bulls Arena Trading
info@bullsarenatrading
New Delhi
India
Suggested Reading–
Most Profitable Patterns in Intraday
Author