When it comes to navigating the turbulent waters of the financial markets, traders are constantly in search of that elusive edge. Amidst the complexities and uncertainties, Flag Chart Patterns emerge as a formidable ally, offering a reliable path to trading success.
In this comprehensive guide, we will dive into the world of Flag Chart Patterns, unravelling their significance, and showcasing how they can become your compass in the vast landscape of trading.
If you’re ready to chart a course towards more profitable trades – Read on to discover the power of Flag Chart Patterns and how they can transform your trading strategy.
Table of Contents
- 1. What is a Flag Chart Pattern?
- 2. Types of Flag Chart Patterns
- 3. Identifying the Flag Pattern
- 4. Statistics: The Power of Flag Patterns
- 5. Trading Strategies with Flag Patterns
- 6. Real-World Examples
- 7. Limitations of Flag Pattern
- Conclusion
- Frequently Asked Questions On Flag Chart Pattern
As legendary trader Jesse Livermore once remarked, “There is only one side to the stock market, and it is not the bull side or the bear side, but the right side.” Let’s explore how Flag Chart Patterns can help you find that right side.
1. What is a Flag Chart Pattern?
The Flag Chart Pattern is a continuation pattern commonly used by traders to identify potential trend extensions. Its title is derived from its visual portrayal, which closely mimics the appearance of a flag hoisted on a pole

2. Types of Flag Chart Patterns
The Flag Chart Pattern is categorized into two main types: the bullish flag and the bearish flag.
Bullish Flag Pattern
A Bull Flag is a bullish continuation pattern that typically occurs within an uptrend. It represents a brief consolidation or pause in the price movement before the prevailing uptrend resumes.
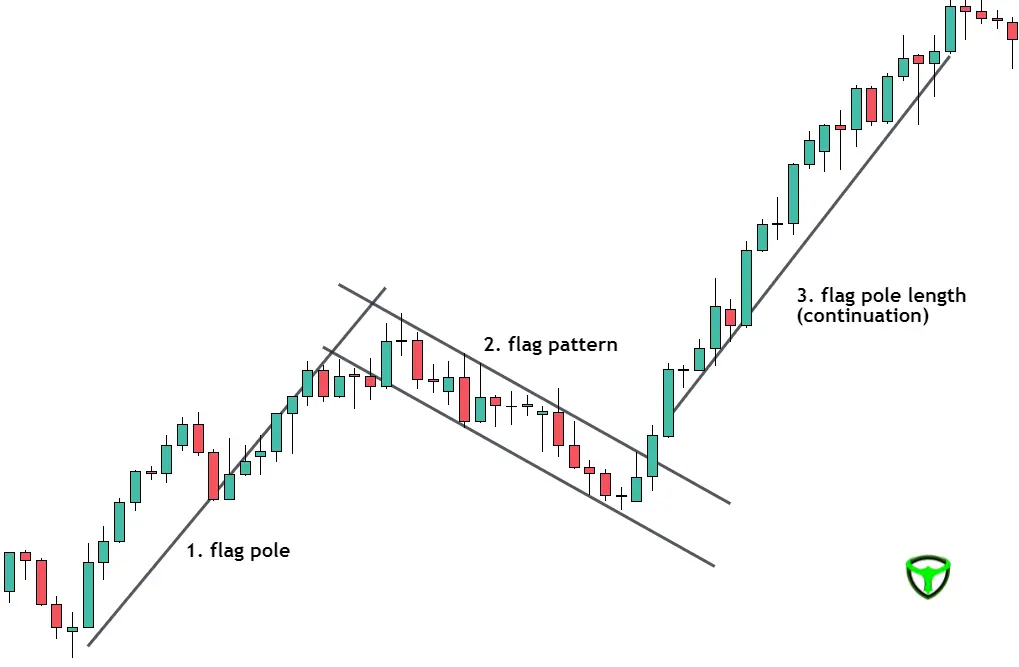
Identifying a Bull Flag involves recognizing specific characteristics, such as a flagpole and a flag component. Traders often employ strategies like breakouts above the flag to capitalize on potential price surges.
In a bullish flag pattern, the preceding trend is upward, indicating a bullish sentiment in the market. The flag represents a temporary pause before the uptrend resumes.
Bearish Flag Pattern
On the flip side, a Bear Flag is a bearish continuation pattern found within a downtrend. It signifies a temporary pause in the downward price movement before the downtrend resumes.
Traders seek to identify Bear Flags through specific features and apply strategies like short selling or put options to profit from potential price declines.

In a bearish flag pattern, the prior trend is downward, signifying a bearish sentiment. The flag, in this case, represents a short consolidation period before the downtrend resumes.
3. Identifying the Flag Pattern
Now that we understand the conceptual foundation of the Flag Chart Pattern, let’s explore how to identify it accurately.
Key Characteristics
To identify the Flag Chart Pattern, we need to look for the following key characteristics:
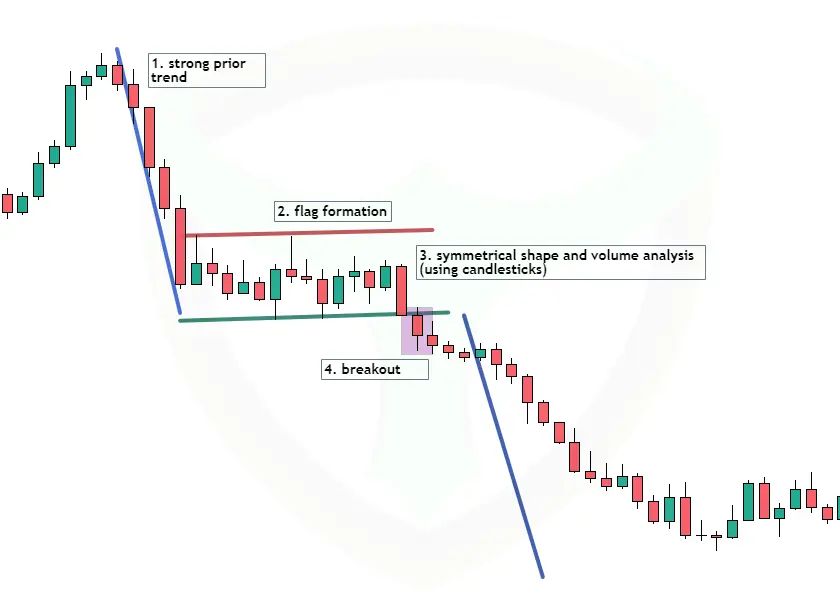
- Strong Prior Trend: The pattern should follow a notable price move, the flagpole, in a specific direction.
- Flag Formation: Following the flagpole, a consolidation phase forms, creating the flag.
- Symmetrical Shape: The flag should ideally take a symmetrical rectangular shape, with parallel trend lines.
- Volume Analysis: Volume plays a vital role in confirming the pattern. During the flag formation, trading volume often decreases, reflecting reduced market participation. Traders can also use candlestick sizes to gauge the intensity of market moves.
- Breakout: The pattern concludes with a breakout in the same direction as the prior trend.
4. Statistics: The Power of Flag Patterns
Now that we’ve established the fundamentals of Flag Chart Patterns, let’s turn our attention to the statistics behind their effectiveness. Understanding the historical performance of these patterns can provide valuable insights for traders.
| Statistical Insight | Bullish Flag Patterns | Bearish Flag Patterns |
|---|---|---|
| Success Rate | Approximately 65% | Approximately 70% |
| Following Breakout | Around 15% Price Increase | Approximately 12% Price Decline |
| After a Longer Consolidation | More Substantial Price Gains | More Significant Price Declines |
It’s important to note that while these statistics provide a general idea of the pattern’s performance, no trading strategy guarantees success every time. Traders should always exercise caution and combine pattern analysis with other technical and fundamental factors.
5. Trading Strategies with Flag Patterns
1. Entry and Exit Points
Entry Point: Traders often enter a position at or slightly above the breakout point (bullish flag) or below the breakout point (bearish flag) from the flag pattern.
Exit Point: To manage risk, set a stop-loss order just below the flag pattern’s low (bullish flag) and above the flag pattern’s high (bearish flag).

2. Measuring Price Targets
To determine potential price targets following a flag breakout, traders can use the following methods:
For Bullish Flags: Measure the length of the flagpole and add it to the breakout point to estimate the potential upward move.
For Bearish Flags: Measure the length of the flagpole and subtract it from the breakout point to estimate the potential downward move.
3. Confirmation Indicators
To increase the reliability of your trades, consider using confirmation indicators such as Relative Strength Index (RSI), Moving Averages, or Volume analysis in conjunction with the Flag Chart Pattern.
6. Real-World Examples
Let’s take a look at some real-world examples to see how Flag Chart Patterns have played out in actual market conditions.
Bullish Flag – Tesla Inc. (TSLA)
In early 2023, Tesla Inc. (TSLA) exhibited a classic bullish flag pattern. After a significant uptrend, TSLA’s price began consolidating in a rectangular fashion.

This consolidation period served as a temporary pause in the upward momentum, allowing traders to anticipate a potential continuation of the bullish trend
The continuation movement was confirmed by a breakout on May 23rd. Additional confirmation was provided by the Moving Average Cross, which occurred during the consolidation period.
7. Limitations of Flag Pattern
For a flag pattern to confirm the continuation signal, there must be a recent sharp price movement, followed by a minor retracement.
- A clean breakout validates the market’s prevailing trend.
- It is better to avoid small breakouts with long shadows.
- In a sideways market, flag patterns do not work.
- A Flag Pattern suggests a continuation, rather than a reversal.
Conclusion
- A Flag stock chart Pattern can be bullish or bearish. Flags can appear in any time frame, although they typically consist of 15 to 30 price bars, depending on timeframes.
- Flags have an extremely high risk-to-reward ratio, which indicates a little risk and big rewards.
- To increase the chances of success, traders integrate this pattern with other types of technical analysis.
- When there is an uptrend, a flag is termed a bullish flag. In the case of a decline, a flag is termed a bearish flag.
- When markets are trending, they usually take short breaks in the form of flags and pennants, making the Flag Chart Pattern an excellent pattern in both bull and bear markets.
Frequently Asked Questions On Flag Chart Pattern
Q1: What is a Flag Chart Pattern?
A Flag Chart Pattern is a technical analysis pattern in stock trading and other financial markets. It resembles a flag on a pole and is used to identify potential price continuation or reversal trends.
Q2: How does a Flag Chart Pattern form?
A Flag Chart Pattern typically forms after a strong price movement, known as the “flagpole.” It consists of two parallel trendlines, one representing support and the other resistance. The price consolidates within these lines, forming a flag-like shape.
Q3: What is the significance of a Flag Chart Pattern?
The Flag Chart Pattern is significant because it indicates a temporary pause or consolidation in the market after a strong trend. Traders often interpret it as a potential continuation of the previous trend.
Q4: How can traders use Flag Chart Patterns for trading decisions?
Traders use Flag Chart Patterns to:
Identify potential entry points for trades when the price breaks out of the flag pattern.
Set stop-loss and take-profit levels to manage risk.
Confirm their overall market analysis and trend predictions.
Risk Disclaimer
We understand that navigating the financial world can be challenging. The content on this blog is for educational purposes, not financial advice. Before making decisions, consult a qualified advisor who understands your unique situation. Keep in mind that investing involves risks, and past performance isn’t a guarantee of future results. We genuinely care about your financial well-being, but we cannot be held responsible for any losses or legal issues that may arise from your financial choices. Please use this information responsibly and consider seeking professional guidance when needed.
Note :– Flag Chart Pattern is also part of our Technical Back Testing report on Most Profitable chart Patterns & Day Trading Patterns
Author