

Power of the Pennant Pattern in Technical Analysis
Welcome to an in-depth exploration of one of the most compelling chart patterns in technical analysis – the “Pennant Pattern”. In the world of finance, understanding the intricacies of chart patterns can provide invaluable insights for traders and investors alike.
The Pennant Pattern, often referred to as a continuation pattern, plays a pivotal role in predicting future price movements. In this comprehensive blog post, we will delve deep into the Pennant Pattern, shedding light on its characteristics, how to identify it, and strategies for trading it effectively. By the end of this article, you will be equipped with actionable knowledge that can help you make informed trading decisions.
Table of Contents
- Power of the Pennant Pattern in Technical Analysis
- 3: Identifying the Pennant Pattern
- 4: Trading Strategies with Pennant Patterns
- 5: Difference Between Bullish and Bearish Pennant Pattern
- 6: Real-world Examples and Statistical Insights
- 7: Tips for Effective Trading
- Conclusion & Key Takeaways
- Frequently Asked Questions
1: What is Pennant Pattern?
Before we dive into the technical details, let’s grasp the essence of the Pennant Pattern. Imagine a flag fluttering in the wind – the Pennant Pattern is named for its resemblance to this triangular flag shape. It is primarily a short-term continuation pattern, signaling a temporary pause in a prevailing trend before the price continues its prior trajectory.
Pennant patterns, like FLAG PATTERNS, are a subset of technical analysis tools used by traders to identify potential price continuation patterns in financial markets. These patterns are visual representations of price movements on a chart, offering valuable insights into future price action.
2: Characteristics of the Pennant Pattern:
Symmetrical Triangle:

The Pennant Pattern is characterized by a symmetrical triangle formation. This means that the price range narrows over time, forming converging trendlines.
Consolidation Period:
The pattern represents a consolidation period where the market takes a breather after a significant price move.
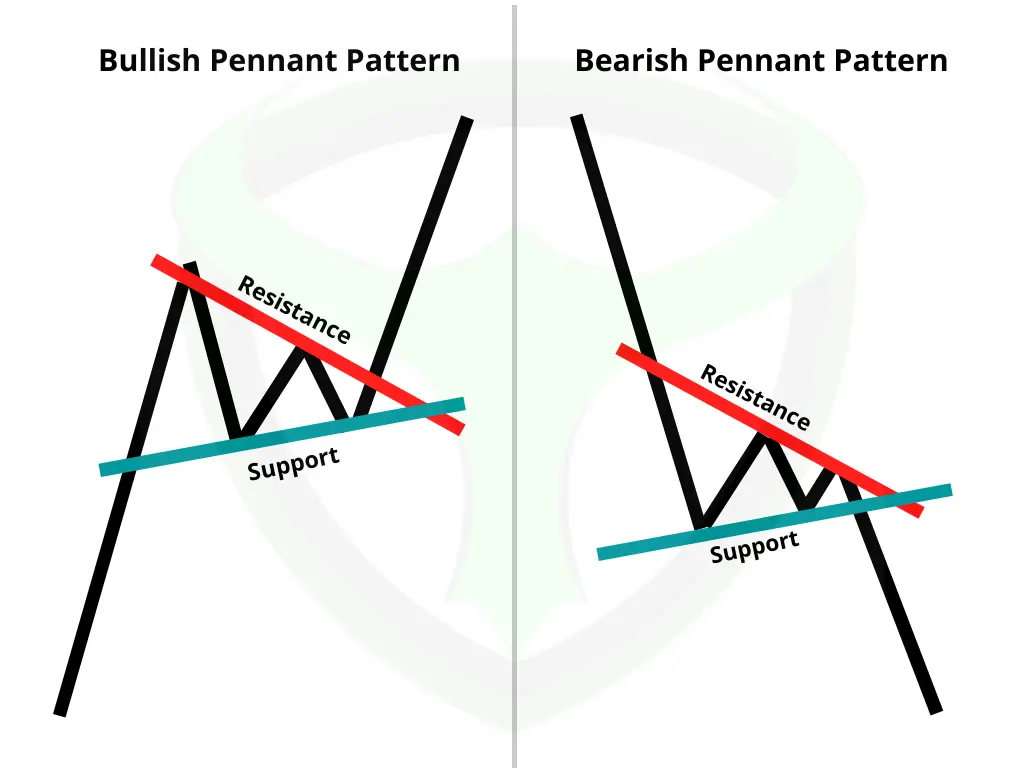
Types of Pennant Patterns:
There are both bullish and bearish pennants, and their implications differ.
(i) Bullish Pennants
Bullish pennants are a favorite’s among traders as they signal potential buying opportunities. These patterns typically form during strong uptrends, offering a chance to enter or add to a long position.

(ii) Bearish Pennants
Bearish pennants, on the other hand, are valuable for traders looking to profit from potential downturns in the market.

3: Identifying the Pennant Pattern
In the world of technical analysis, identifying chart patterns accurately is crucial. The Pennant Pattern can be identified by its distinct features:
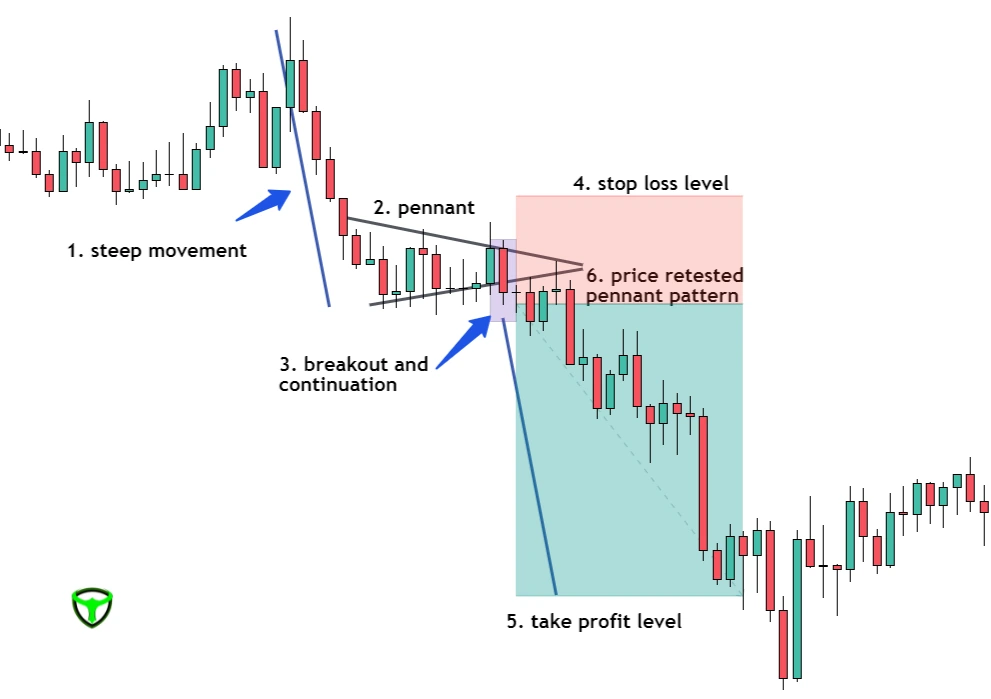
a. Price Trend Leading to the Pennant:
Before a Pennant Pattern forms, there is a significant price move in one direction. This move is what gives rise to the pennant formation. It’s essential to understand that the Pennant Pattern is not a standalone pattern but rather a part of a more extensive trend.
b. Symmetrical Triangle Formation:
As mentioned earlier, the Pennant Pattern is characterized by a symmetrical triangle. This means that there are two converging trendlines, one representing support and the other representing resistance. The price oscillates within this triangular structure.
c. Decreasing Volume:
During the formation of the Pennant Pattern, you should observe a decrease in trading volume. This decline in volume is indicative of the market taking a pause, which aligns with the consolidation phase.
d. Duration:
Pennant Patterns are typically short-lived, lasting anywhere from a few days to a few weeks. It’s essential to consider the timeframe you are trading in when identifying and trading this pattern.
e. Prerequisites for Pennant Pattern Recognition
- Established Trend: The first prerequisite for spotting a pennant pattern is an established trend. Pennants are generally considered continuation patterns, meaning they often occur within the context of an existing price trend, whether upward (bullish) or downward (bearish). Before looking for a pennant, confirm that the market has been trending.
- Flagpole Formation: The flagpole is a critical element of a pennant pattern. It represents the initial strong price movement that precedes the consolidation phase (the pennant itself). Ensure that there is a clear and identifiable flagpole with a significant price change over a relatively short period.

Chart Analysis Tools and Indicators for Assistance
Candlestick Patterns: Candlestick charts can provide valuable insights when identifying pennant patterns. Look for specific candlestick formations within the pennant that indicate indecision or a potential breakout, such as Doji candles or spinning tops.

Moving Averages: Exponential moving averages (EMAs) and simple moving averages (SMAs) can be used to smoothen price data and identify the direction of the trend. When the price is above the moving average and the moving average itself is sloping in the direction of the trend, it adds confidence to the presence of a pennant.

Relative Strength Index (RSI): The RSI is a momentum oscillator that can indicate whether an asset is overbought or oversold. When combined with pennant patterns, RSI readings can help identify potential breakout points.

4: Trading Strategies with Pennant Patterns
Bullish Pennant Trading Strategy
When you spot a bullish pennant formation, it’s an opportunity to consider going long in the market. In this section, we’ll explore specific entry points, stop-loss considerations, and risk management techniques for trading bullish pennants.
Entry Points and Stop-Loss Considerations
- Entry Points: Look for a breakout above the upper boundary of the pennant. This breakout should be accompanied by increased volume, signaling strong buying interest.
- Stop-Loss: Place a stop-loss order just below the lower boundary of the pennant. This level acts as a safeguard in case the pattern fails to play out as expected.
Risk Management Techniques
To excel in trading, it’s crucial to handle risk wisely. You should understand how to determine the size of your positions based on how much risk you’re comfortable with. Additionally, think about implementing trailing stop-loss orders to safeguard your profits as your trade develops.

Bearish Pennant Trading Strategy
Trading bearish pennants involves taking a short position in anticipation of a downward price movement. In this section, we’ll delve into entry and exit strategies, as well as risk mitigation techniques for bearish pennants.
Optimal Entry and Exit Strategies
- Entry Points: A bearish pennant’s entry point is usually the breakout below the lower boundary of the pattern. Look for a surge in selling volume to confirm the bearish sentiment.
- Exit Strategies: Consider setting profit targets at key support levels or using trailing stop-loss orders to secure gains as the price declines.
Risk Mitigation Strategies
Engaging in bearish trading involves specific risks. Discover how to effectively handle these risks by adjusting your position sizes, diversifying your investments, and establishing well-defined risk-reward ratios for your trades.
5: Difference Between Bullish and Bearish Pennant Pattern
| Bullish Pennant | Bearish Pennant |
| Formed after an upward move, followed by a small triangle | Formed after a downward move, followed by a small triangle |
| Continuation of a bull market | Continuation of a bear market |
| A breakthrough resistance trend line | A breakthrough support trend line |
6: Real-world Examples and Statistical Insights
To provide you with a tangible understanding of the Pennant Pattern’s power, let’s explore a real-world example:
Example : Bullish Pennant on APPLE Stock
Date Range: Jun 2020 – Sep 2020
Stock: Apple Inc.
Price Movement: Apple stock experienced a sharp upward move from $72 to $136 over the course of three months ( 86.77%).

In this example, the price of Apple stock exhibits a classic bullish pennant formation. As you can see, the symmetrical triangle, decreasing volume, and consolidation period are evident. Now, let’s dive into the statistics:
The pennant pattern has indeed secured its place in our backtesting report, which stems from the technical analysis research conducted by the Bulls Arena Trading Team on the most profitable chart patterns.
Here are some of the insights from the report on Pennant pattern performance over a period of twelve months.
Success Rate: Historical data indicates that bullish pennants have an 59% success rate in leading to higher prices.
Average Gain: On average, when a bullish pennant is confirmed, it leads to a price increase of approximately 50%.
Average Duration: The duration of bullish pennants ranges from 5 to 10 days.
This statistical analysis demonstrates the actionable insights that can be gained from recognizing and trading the Pennant Pattern.
7: Tips for Effective Trading
- Emotional Management is Vital: Emotions can be a trader’s best friend or worst enemy. To trade effectively, it’s crucial to keep emotions in check. Develop a disciplined mindset that helps you stay calm and rational, even in the face of significant market fluctuations.
- Set Realistic Expectations: Trading is not a guaranteed path to instant wealth. Set realistic expectations for your trading performance and goals. Understand that losses are a natural part of trading, and success often comes from a series of well-executed trades rather than a single big win.
- Continuous Learning is Key: The financial markets are dynamic and constantly evolving. Make learning a continuous process. Stay updated on market news, trading strategies, and technological advancements. Consider reading books, attending seminars, and engaging with trading communities to expand your knowledge.
- Risk Management is Non-Negotiable: A solid risk management strategy is paramount to long-term trading success. Determine how much capital you’re willing to risk on each trade, set stop-loss orders, and diversify your portfolio to spread risk. Never risk more than you can afford to lose.
- Adaptation and Flexibility are Essential: Markets change, and what works today may not work tomorrow. Be adaptable and open to adjusting your trading strategies when market conditions shift. Avoid falling into the trap of sticking to a single approach when it’s no longer effective.
Conclusion & Key Takeaways
- Pennants resemble triangles but are considerably smaller.
- They are followed by significant price rises or declines and indicate that the market is taking a rest before continuing its direction.
- Pennant stock chart pattern, you see, maybe little in size, but they may predict big price movements, so don’t underestimate them.
- Traders are looking for a break over the pennant to capitalize on the momentum.
- Bearish pennants form when a bearish trend stops, and bullish pennants form when a bullish move pauses.
- Bullish and Bearish pennant patterns works best in both bull and bear market
- Pennant patterns are best risk to reward patterns in technical analysis of chart patterns trading.
- Failed pennant pattern is itself a very good signal for reversal trades
- Pennant pattern is very easy to spot and even more easy to trade with.
With this knowledge, you’re better equipped to navigate the dynamic world of financial markets and incorporate pennant patterns into your trading strategy. May your trading endeavors be both informed and prosperous. Happy trading!
Note: Always conduct thorough research and consider seeking advice from financial professionals before making any investment decisions. This article is for educational purposes only and should not be construed as financial advice.
Frequently Asked Questions
What is a Pennant Pattern in trading?
A Pennant Pattern is a technical analysis chart pattern that resembles a small symmetrical triangle. It forms after a strong price movement and represents a brief consolidation before the price continues in the direction of the prior trend.
How do I identify a Pennant Pattern on a price chart?
To identify a Pennant Pattern, look for a strong price move followed by converging trendlines forming a small symmetrical triangle. The converging trendlines should have roughly equal slopes.
What is the significance of a Pennant Pattern in technical analysis?
The Pennant Pattern is significant because it suggests a temporary pause in the market before a potential continuation of the previous trend. Traders often use it to anticipate future price movements.
Can you explain the difference between a bullish and bearish Pennant Pattern?
A bullish Pennant Pattern occurs after an uptrend and indicates a potential continuation of the uptrend. In contrast, a bearish Pennant Pattern appears after a downtrend and suggests a possible continuation of the downtrend.
What are some common strategies for trading based on the Pennant Pattern?
Common strategies include placing buy orders above the upper trendline of a bullish Pennant and sell orders below the lower trendline of a bearish Pennant. Traders may also use stop-loss and take-profit orders to manage risk.
Are there any specific entry and exit signals associated with the Pennant Pattern?
Entry signals often occur when the price breaks out of the Pennant in the direction of the prior trend. Exit signals can be generated based on predefined criteria, such as reaching a certain price target or the formation of a new pattern.
Have You Read- Most Profitable Trading Patterns?
Author


There’s definately a lot to learn about this issue. I like all the points you’ve made.