PRICE ACTION TRADING COMPLETE COURSE
Price action trading is by far the most important concept and trading methodology in technical analysis. With my own experience of 10+ years of active trading, I can assure you that the only tool you need for a successful trading career is a good understanding of price action trading.
Chart patterns, bar patterns, candlestick patterns, price continuations and reversals, price channels, support and resistance, Fibonacci levels, pivot points, momentum and volatility, market structure, and trend lines are all examples of price action trading.
If you want to learn everything about price action trading (including how to make money with price action), you’ve come to the right place. Don’t worry, you don’t have to learn everything in a single day; instead, use this guide as a reference to your trading and return for more detailed explanations of each topic you want to explore.
Table of Contents
- PRICE ACTION TRADING COMPLETE COURSE
- 2.0 Types of Price Action Trading
- 3.0 Momentum & Volatility in Price Action Trading
- 4.0 Price Action Trading Strategies
- 5.0 Most Important Rule in Price Action Trading
- 6.0 Price Action Trading Books
- Price Action Trading FAQ
1.0 Introduction to Price Action Trading
What is Price Action Trading?
Price action trading is the practice of forecasting and trading based on price movements and the patterns formed by these movements.
Pure price action trading insists on ignoring all factors, including fundamental analysis, economic or political news or events, because everything is reflected in price.
However, over time, price action trading has evolved to include many indicators to support primary price action and to use multiple confluence factors to make trading decisions.
Basic design and methodology however remains same – “Using past and current price action to gauge future direction of price move”
Price action trading strategies implement the principle of using multiple confluence factors such as volume, momentum, volatility, indicators, chart patterns, candlesticks, support and resistance
This broadens the scope of price action beyond simple price analysis; in this ultimate guide to price action, we will cover everything relevant and important for price action-based trading strategies.
History of Price Action Trading
Price action trading has a long history dating back to the days of floor trading and tape reading. When there was no volume information on the tapes, technical analysis simply meant reading the tape price and speculating on the next price move.
Foundation of price action trading was laid by Charles H. Dow who’s collective works in Dow-Jones financial news service (Wall Street Journal) were introduced as “The Dow Theory” in 1932.

Dow theory, which became the foundation of price action trading, supports the efficient market hypothesis by stating that all information about the current state of the market is reflected in price.
For the first time, Dow proposed the price and volume relationship and its importance in trending markets, but it was Richard Wyckoff who developed a method of analyzing price and volume in relation to price movement and used price action trading to make huge profits in the stock market.
His methodology suggested that if one wants to make money in financial markets, one should trade in the direction of the big traders who move the markets; one way to get a sense of what the big players are doing is to analyze price movement in relation to volume.
“Listen to what the market is saying about others, not what others are saying about the market.”
– Richard Wyckoff
In his historical book Reminiscences of a Stock Operator, American author Edwin Lefèvre describes the trading style of famous trader Jesse Livermore, who began as an active price action trader.
Market Structure & Price Action
To understand price action trading, it is necessary to first gain a thorough understanding of current price action in relation to market structure. Understanding the fundamentals of market structure will help you analyze price action more effectively.
There are mainly three types of market structures –
- Consolidation

When the market moves within a range, it is difficult to predict which direction the overall price move will take. This creates a trading range structure. Trading ranges are most commonly seen in all types of markets; they result from the equilibrium that exists between buyers and sellers, where neither can move prices in a specific direction.
- Trending

A trending market structure forms when prices move in one direction for an extended period of time. The timeframe used here is determined by the observer’s perspective, such as daily, weekly, or monthly.
Market trends emerge as a result of bullish or bearish price action. When buyers or sellers dominate price movement for a specific time period, trends emerge and allow traders to take positions in trend direction. If you can identify a trend early, that is all you need to make big money in markets.
- Reversal

The third type of market structure is reversal, which occurs when a trend continues and is more likely to reverse sooner or later. When this occurs, a market structure emerges that suggests potential weakness in the underlying trend, and traders use this hint to take positions in the opposite direction of the trend in anticipation of a reversal.
Behavioral & Psychological Aspects
Market psychology is the foundation of technical analysis; prices move as a result of the mass psychology of buyers and sellers. It is therefore obvious that market psychology is the primary driving force of price action.
Human psychology influences price action in a variety of ways, including Fibonacci levels, support and resistance levels, and pivot points, which all relate to what the majority of market participants think of these levels.
For example, if a stock is trading at 190, there is a psychological barrier at 200 that most traders consider to be resistance. A price action trader waits for this barrier to be crossed before taking a bullish position in the stock because he knows that once the price is above 200, the stock has a better chance of moving higher because the psychological resistance has been broken.
Thus, breakout trading is simply the result of mass human emotions; as these psychological levels are tested and broken, more and more traders join the rally.
Importance of Price action in Technical Analysis
One of the most important reasons I began trading in the first place is that I understood my edge from the start. An edge simply means my advantage over large players in the stock market. The only advantage I can have in such a competitive space is my skills and understanding of technical analysis combined with time spent developing a trading mindset.
I don’t have the most resources to keep up with what’s going on in the world economies, events, or within companies, but I can always look at price movements to gauge market sentiment.
So, like me, there are many traders out there who only need two pieces of information to place bets: price and volume.
Here are the three most important reasons why you should trade using price action-
- To get an understanding of market structure and to be on the right side of the market makes you in a better position of placing a winning trade.
“There is only one side of the market, and it is not the bull side or the bear side, but the right side.”
Jesse Livermore
- To know what collective human behaviour represents, to not just stick to fancy names of the patterns but to understand the psychology of chart patterns, candlestick patterns or bar patterns.
- To understand – when not to trade, it is perhaps the most important learning in your journey in trading and financial markets, you need to understand there are a lot of false signals and fake breakouts. Additionally there are times of absolute silence which is also known as “ market noise”
2.0 Types of Price Action Trading
If you are overwhelmed with information about price action trading, please wait a little longer. There are many types of methods by which price action is known in the modern world, but you do not need to know or use everything to become a profitable price action trader. Instead, I would like to propose a different approach to price action trading: learn the fundamentals of each method, use it in backtesting and paper trading, and then specialize in the type that best suits you.
Some traders prefer to use a combination of the methods listed below; there is nothing wrong with that either. Remember, there is no right or wrong in trading; what works for you is right; everything else can be ignored.
(i) Price Action Bar Patterns Trading
Bar patterns are short-term patterns used in price action trading to identify trade entry points and short-term support or resistance. They can also be used to determine logical stop-loss points.
It is important to understand them because they can be useful when placing trades. Understanding price action bar patterns allows traders to make better risk-reward trades.
There are 10 bar patterns every trader should know about –
- One Bar Reversal
- Two-Bar Reversal
- Three-Bar Reversal
- Key Reversal Bar
- Pin Bar
- Exhaustion Bar
- Horn Pattern
- Inside Bar
- Outside Bar
- Narrow Range 7
One Bar Reversal Pattern
One bar reversal pattern is also called reversal bar pattern, one bar reversal pattern is of two types –
- Bullish Reversal

A bullish reversal bar forms when the price opens below the low of the preceding bar and closes above it. When the low of the previous bar acts as support, prices test this level before rising and closing above the previous day’s low.
- Bearish Reversal

A bearish reversal bar is said to have formed when the price opens higher than the high of the prior bar and closes lower than it.
For the bearish pattern, the market encountered resistance above the previous bar’s high. Furthermore, the resistance was sufficiently strong to cause the current bar to close lower.
Two Bar Reversal Pattern
Two bar reversal patterns are made up of two consecutive bars that are nearly the same height but close in opposite directions.
A bullish two bar reversal occurs when a strong bearish bar is followed by an equally strong bullish bar that closes near the previous bar’s high.
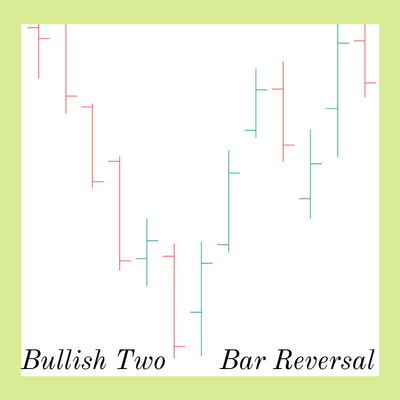
A bearish two bar reversal occurs when a strong bullish bar is followed by a bearish bar of equal magnitude that closes near the low of the bullish bar.

Three Bar Reversal Pattern
Three bar reversal pattern is much more reliable reversal pattern which is made up of three bars, to understand the context of each bar making up the three bar reversal let us look at below table :-
Bullish Three Bar Reversal
| First Bar | Second Bar | Third Bar |
| A bearish bar | Lower high & lower low than first bar | Higher low & close above the high of second bar |
Bearish Three Bar Reversal
| First Bar | Second Bar | Third Bar |
| A bullish bar | Higher high and higher low than first bar | Lower high and close below the low of second bar |
Three bar reversals are used to identify market turning points; typically, they indicate short-term reversals and assist traders in locating stop losses.
Key Reversal Bar

The key reversal bar is a significant single bar pattern that is typically used only in the daily timeframe.
Because a key reversal bar involves a gap down or gap up opening, it is best suited for daily timeframes.
For a bullish key reversal bar to occur, the first bar should be bearish, and the second day market should open with a gap down, but the gap fills quickly and the market closes above the first bar, indicating a bullish key reversal.
Similarly, for a bearish key reversal bar pattern, a bullish candle is followed by a gap up opening that usually fills up in the first half of the market time and closes below the low of the first bar in the second half, indicating a bearish key reversal.
I personally use key reversal bar patterns in trading in conjunction with my setup; they are difficult to ignore in price action trading; when you know something has changed, it is better to adjust your positions accordingly.
Pin Bar

A pin bar, also known as a Pinocchio bar, has a long tail in either direction. A bearish pin bar has a long tail above the body, while a bullish pin bar has a long tail below the body.
A pin bar is also an important bar to understand and to use in price action trading. Using pin bars in your trading can vary from setup to setup, but the actual definition of a pin bar remains the same.
These price levels can sometimes coincide with support or resistance levels, which is a great trading signal.
A bullish pin bar indicates rejection of underlying support, which could be a price support level, moving average, or fibonacci ratio. If this occurs, the idea is to go long if the long-term trend is bullish.
Similarly, if a bearish pin bar appears at a resistance and the major trend is bearish, a short entry in the direction of the major trend is recommended.
Exhaustion Bar

As the name implies, the exhaustion bar represents exhaustion or a failed attempt at one-sided dominance.
In the case of bullish exhaustion, the market opens with a gap down, but bears are unable to gain control, and bullish momentum drives prices higher, indicating a bullish signal even though the gap remains unfilled.
Similarly, in the case of bearish exhaustion, the market gaps up but soon bears take control and push prices downwards, signalling short trades.
Horn Pattern


Two bars are separated by a small bar, which represents a horn bar pattern. Horn bar patterns are typically used in weekly timeframes to signal long term reversals.
Horn patterns are of two types – Horn top and horn bottom.
Advance Reading – How to Trade Horn Chart Patterns?
Inside Bar

The inside bar pattern is made up of two bars, one being the mother bar and the other being the inside bar. The inside bar has two main characteristics: its high is lower than the previous bar’s high and its low is higher than the previous bar’s low.
Inside bars signify a brief pause in price movement and show that neither bulls nor bears are sufficiently confident to move prices in either direction. The direction of price movement may be determined by the breakout from the inside bar’s high or low.
In addition, the inside bar represents the immediate support and resistance levels for the upcoming price action.
Some traders I have met who only trade inside bars, I have been able to sneak into their trading strategy – Inside Bar Candlestick Pattern Trading
Outside Bar

When it comes to formation, an outside bar is the exact opposite of an inside bar. In an outside bar, the first bar is smaller and the second bar completely engulfs the first bar. The second bar also has more volume and momentum than the first bar.
At key levels of support and resistance, outside bars add additional confluence; their formation at such critical points denotes a potential reversal.
Narrow Range 7

NR7 is made up of 7 bars that represent decreasing volatility and consolidating price action; the last bar is the smallest of the seven. NR7 represents a temporary pause in price action as well as a contraction in volatility.
The NR7 formation is an important price action pattern that can lead to explosive breakout scenarios in either direction.
One important tip for trading NR7 is to consider price action prior to pattern formation, particularly the major trend; breakouts in the direction of the preceding trend are usually of primary importance in price action trading.
(ii) Price Action Trading with Candlestick Patterns
Candlestick charts have been my go-to tool for technical analysis since the day I first started trading. Since their introduction by Steve Nison to the western world, candlestick charts have become the most crucial part of technical analysis.
Even before technical analysis and price action trading techniques were invented, these candlesticks were used in Japan for commodity trading. Munessia Homma is credited with inventing these candlesticks, and I thank him for them because I don’t know how I would interpret market data without them.
We will start from the basics of candlesticks, first let’s talk about a single candlestick structure which looks like this-
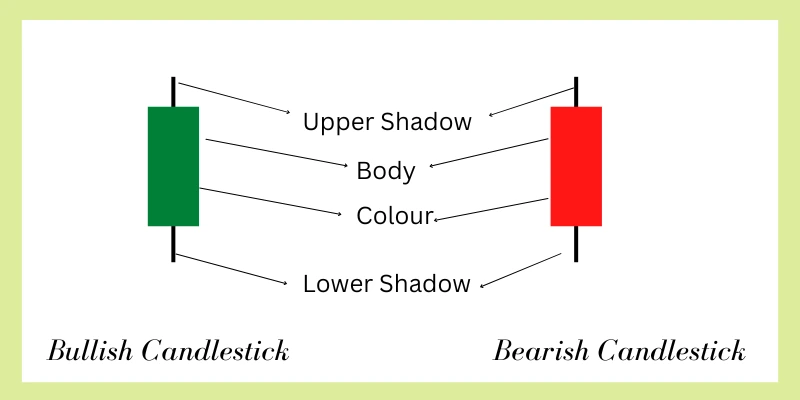
Candlestick has three main components-
Real Body – it represents the price move from the opening to closing, longer body means price has moved significantly from opening price while short body means price has not been able to move very much from the opening.
Wick or Shadow – The wick, also known as the candlestick’s shadow, represents the day’s high or low. Some candlesticks do not have wicks, so the high and low of the day are the same as the opening and closing price.
Color – The color of a candlestick indicates the direction of price movement; green candlesticks represent bullish price movement, while red candlesticks represent bearish price movement. A bullish candle is formed when the closing price is greater than the opening price, while a bearish candle is formed when the closing price is less than the opening price.
Some broker platforms may display colors other than green and red; this is fine; however, when analyzing candlestick charts, it is critical to note the bullish and bearish equivalents of colors.
A very important consideration when analyzing candlestick charts is the context of price analysis. It is possible that a green candlestick might signal a bearish price move and vice versa.
To understand this better we need to look into the basics of price action – battle between bulls and bears and how you can take advantage of this battle –
Foundation of price action trading with candlesticks –
Every candlestick formation is the result of a constant battle between bulls and bears; only when a candlestick is completely formed can you tell what happened and who won this battle.
Candlesticks with a longer upper wick indicate that there is strong selling pressure, whereas candlesticks with a large wick downward indicate that bulls dominated the price move.
Consider a green candlestick with a very long upper wick and the high of the day is a very strong resistance from where the prices moved downwards; even though the candle is green, this type of formation is considered a bearish signal.
The key is that you must examine body, wick, color, and price levels all at once to comprehend the significance of candlesticks.
This is precisely what we will cover in the following sections using candlestick patterns and their practical application in price action trading.
Candlestick Patterns For Price Action Trading
In his book of Encyclopedia of candlestick charts, Thomas Bulkowski has explained 103 candlestick patterns. Now when I first started using candlestick charts I was overwhelmed with their names and purpose. You don’t have to go through the same suffering and forget about remembering 103 candlestick patterns.
I have listed out the most important and the only candlestick patterns you need to know in order to use them in your trading setup.
To get the most out of these useful candlestick patterns, try identifying them in real-world charts and relating their purpose to price action.


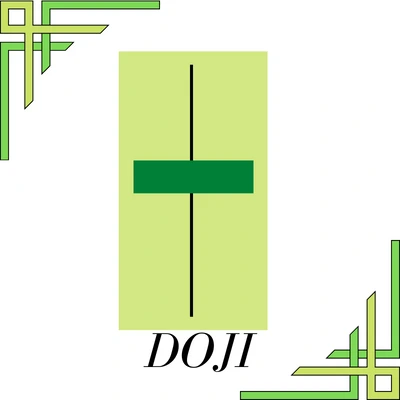


1.0 Doji Candlestick Pattern
- How to Spot?
With same opening and closing price, doji looks like a cross
- What does it mean?
Because the opening and closing prices are the same, a Doji represents market indecision; it indicates that neither bulls nor bears are confident enough to move prices.
- How to trade?
Doji candlestick patterns have different meanings depending on the situation. For example, if a doji appears at the peak of a bullish trend, it could indicate a bearish reversal, especially if it does so at a significant resistance level.
Similarly, if a doji pattern develops at the bottom of a downtrend and support is present nearby, it may indicate a bullish turn.
Doji should be used as an indecisive candlestick if there is no trend; further price action is needed to confirm price movement.
2.0 Marubozu Candlestick Pattern
- How to Spot?
Marubozu candlesticks have no wicks or shadows, and its body represents the entire candlestick. Depending on the closing price, marubozu can be bullish (closing price higher than opening price) or bearish (closing price lower than opening price).
- What does it mean?
In contrast to doji, marubozu clearly shows the dominance of bulls or bears depending on the color of the candlestick.
- How to trade?
Marubozu candlestick can be combined with other factors to trade market strength, if a breakout happens from key level or any pattern with marubozu it is considered a reliable signal to trade.
Other than the significance of a single marubozu candlestick, it is used along with other candlesticks to gauge directional price move.
3.0 Harami Candlestick Pattern
- How to Spot?
In japanese Harami means pregnant lady, to spot a harami candlestick pattern just remember that the second candlestick is completely enclosed by the first one.
Bullish harami is formed if the second candle’s body is within the first candle and If the first candle’s closing price is below opening price.
Bearish harami is formed when the closing price of the first candle is above the opening price and the second candle is within the body of the first candle.
- What does it mean?
Bullish harami at support level especially during a downtrend is a bullish signal while bearish harami at resistance level during an upturned might trigger a bearish reversal.
- How to trade?
Harami patterns alone are of little significance but when bullish harami or bearish harami is combined with key reversal price levels they are used to enter counter trend positions, they also allow us to place meaningful stop loss at entry.
4.0 Engulfing
- How to Spot?
Engulfing candlestick pattern is just opposite of harami, in engulfing pattern the body of second candlestick completely engulfs the body of first candlestick.
- What does it mean?
Bullish Engulfing-when formed in a support level or during a downtrend, this can indicate that the downtrend is possibly coming to an end.
When a bearish engulfing pattern forms in an uptrend or at a resistance level, it indicates that the uptrend may be coming to an end.
- How to trade?
Engulfing patterns, like harami candlestick patterns, should be used in conjunction with resistance and support levels to identify reversals.
5.0 Piercing Line Candlestick Pattern
- How to Spot?
Piercing line is a two-bar pattern in which the first candlestick is bearish and the second candle opens a gap down and closes somewhere above the middle of the first candlestick.
- What does it mean?
Piercing line candlestick indicates a strong bullish momentum, since not only the bulls are able to fill the gap but also they managed to cover more than half of previous days selling.
- How to trade?
A Bullish signal is generated if the next candle is bullish and closes above the second candlestick of the piercing line candlestick pattern.
6.0 Dark Cloud Cover
- How to Spot?
The dark cloud cover candlestick pattern is the inverse of the piercing line; the first candlestick is bullish, and the second candlestick opens a gap up above the first candle and closes somewhere below the first candlestick’s midpoint.
- What does it mean?
Bullish sentiments generated by the gap up opening are crushed as a result of closing and short covering, causing prices to fall 50% from the previous day’s high.
- How to trade?
If next day prices fall further downwards, it signals more selling pressure, which can initiate a downtrend; however, this must be confirmed with other price action tools such as trends and key levels.
7.0 Hammer Candlestick Pattern
- How to Spot?
Many traders get confused between the hammer, hanging man, and pin bar candlestick patterns, but you don’t have to because they all look exactly the same-
Long lower wick or shadow
Closing near the opening price
Small or no upper shadow/wick
Colour of the candle does not matter in all three cases.
The important point here is that, while a pin bar and a hammer both interpret the same price action, a hanging man works in a different scenario, which we will discuss separately.
- What does it mean?
When a hammer candlestick pattern appears during a downtrend, it indicates a bullish reversal. When a hammer pattern appears at fibonacci retracements or major support levels, it is even more significant and indicates a trend reversal.
- How to trade?
To identify reversal trade opportunities, use the hammer candlestick in conjunction with a fibonacci or key support level. Wait for the next candle to close above the hammer candlestick to confirm a bullish reversal.
8.0 Hanging Man
- How to Spot?
Hanging man and hammer candlestick looks exactly same, the only difference is where they appear-
- During a downtrend – Hammer
- During an uptrend – Hanging man
- What does it mean?
The Hanging Man candlestick pattern is a bearish reversal candlestick pattern that appears during an uptrend. It indicates the bulls’ inability to push prices higher.
- How to trade?
If the next candle is bearish, with the price closing below the low of the hanging man candle, a bearish reversal will occur, and prices may fall further.
9.0 Inverted Hammer
- How to Spot?
Inverted hammer is simply a hammer turned upside down, with a long upper shadow and a small or no lower shadow, and a closing price that is close to the opening price. The color of the inverted candlestick is also unimportant.
- What does it mean?
When an inverted hammer appears at the end of a downtrend, it indicates that bears are unable to push prices lower and that bulls may retake control soon.
- How to trade?
Bullish confirmation is only valid if the next candle closes above the inverted hammer pattern, after which new long positions can be taken or existing short positions should be covered.
10.0 Shooting Star Candlestick Pattern
- How to Spot?
The shooting star pattern looks similar to the inverted hammer pattern, with the exception that it appears during an uptrend.
- What does it mean?
The shooting star pattern indicates a bearish reversal; it shows how bears took control of the price action and brought prices to near the day’s opening, leaving a long tail that indicates rejection of a strong resistance.
- How to trade?
More often than not, you will see a strong key resistance from where the prices have fallen to the day’s opening; if this occurs, the next candlestick formation is critical, and if below the shooting star pattern, short positions may be taken.
11.0 Morning Star
- How to Spot?
Morning star is a three-candlestick pattern that consists of one bearish candlestick, one candlestick with a small body that forms a gap, and one bullish candlestick that closes within the body of the first candlestick.
- What does it mean?
Morning star resembles the three bar reversal we have discussed earlier, works also in the same manner, first candle shows the bearish dominance , second candle creates an indecisions among sellers and third candlestick confirms the bullish control.
- How to trade?
Wait for another candle to close above the third candle to confirm a bullish reversal, indicating that the bulls have regained control.
12.0 Evening Star
- How to Spot?
The evening star is the polar opposite of the morning star; it has one bullish candlestick, one small candlestick with a gap, and one bearish candlestick closing within the body of the first candlestick.
- What does it mean?
Evening star appearance during an uptrend triggers bearish reversal.
- How to trade?
Wait for one more candle to close below the third candlestick of the evening star candlestick pattern for a short signal.
13.0 Three white soldiers
- How to Spot?
Three white soldiers are three back-to-back bullish candlesticks that open near the previous day’s low but close above the previous day’s high.
- What does it mean?
They undeniably indicate a bullish market.
- How to trade?
Go long with the stop loss slightly below the third candlestick of three white soldiers.
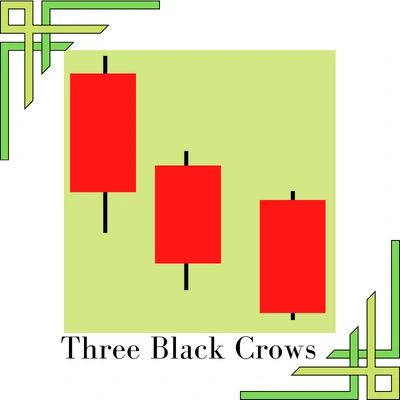
14.0 Three Black Crows
- How to Spot?
Three black crows are simply three bearish candles stacked on top of each other, with each candle’s low being close to the previous candle’s high while closing below the previous candle.
- What does it mean?
Each candle closes below the previous candle’s low, indicating that the market is weak and bears are in control.
- How to trade?
Sell below the third candlestick in three black crows, with a stop loss slightly above the opening of the third candlestick.
15.0 Hikkake Candlestick Pattern
- How to Spot?
The Hikkake candlestick pattern takes advantage of trapped traders and is not a primary candlestick pattern. Hikkake is a critical trading setup, particularly in manipulated markets where many traders become trapped in traditional price action setups.
We need an inside bar pattern first to spot a hikkake pattern; if an inside bar pattern fails with one of the next two candlesticks closing within the range of the primary candle of the inside bar, the hikkake setup is activated.
- What does it mean?
Hikkake setup essentially takes advantage of a failed inside bar pattern; when inside bar patterns fail to materialize, the market often moves in the opposite direction.
- How to trade?
Taking the opposite position to the original inside bar breakout strategy in order to capitalize on a failed breakout.
(iii) Price Action Chart Patterns
Without learning chart patterns, your price action trading knowledge is incomplete. Chart patterns are recognizable patterns created by price movement that repeat themselves repeatedly. Price is more likely to move in the same direction as before when these patterns appear.
You may be wondering how, if every moment in trading is unique (which it truly is), the same patterns can emerge over and over again.
One reason that i can think of and most traders or authors agree to is psychological rather than technical-
Because price movement in markets is driven by greed and fear, psychological memory or market memory of market participants does not change over time, emotions felt by traders on pit trading days and today are the same.
That is why the chart patterns repeat.
Here is a list of all important price action trading chart patterns –
Reversal Chart Patterns
Double Top & Double Bottom Pattern
Continuation Chart Patterns
(iv) Price Action Trading with Support and Resistance
Support and resistance is perhaps the most reliable tool in price action trading; it is the foundation upon which all other price action techniques or analysis is based. Support and resistance are critical areas in any chart, and all other tools complement these two while performing technical chart analysis.
As a result, it is critical that you understand the fundamentals of support and resistance and learn how to apply them in your trading. The story of support and resistance begins with the market’s demand and supply mechanisms.
Basically, any price movement seen in charts is a direct result of demand and supply; when demand peaks and supply is scarce, prices rise; when supply is plentiful but demand is low, prices fall.
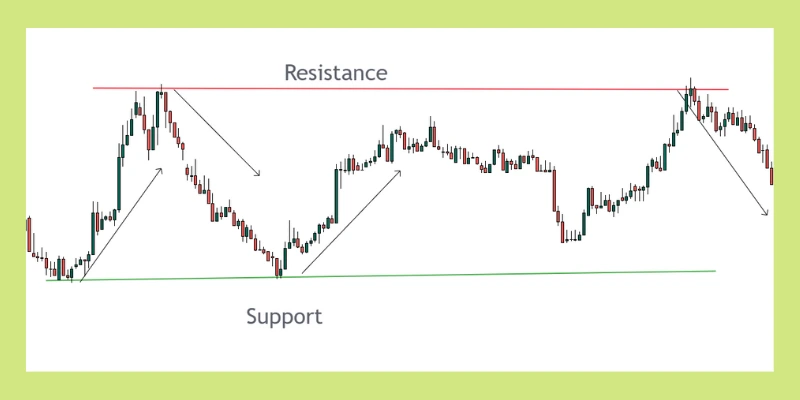
How are support and resistance marked on charts?
On charts, support and resistance are relatively easy to identify; areas where price comes in and moves up can be labeled as support, while areas where price feels resistance and moves down can be labeled as resistance.
To mark support in charts, you simply need at least two such points from which price has moved higher, and for resistance, you simply need two such points from which price has moved lower. You can then draw lines adjoining these two points to mark support and resistance levels.
Types of support and resistance
Primarily there are Three types of support and resistance levels –
- Key levels of support and resistance
- Support levels becoming resistance and resistance becoming support
- Dynamic support and resistance levels
- Key Support and Resistance Levels
It is important to note that not all levels of support and resistance are equal; some are stronger than others. Higher time frames have more significant levels, while lower time frames have weaker support and resistance.
Another important technical viewpoint for support and resistance is that the more it is tested, the weaker it becomes.
- Support becoming resistance and vice versa

When prices retrace back to a support level after a breakout, it acts as a resistance level, and similarly, when a resistance level is broken, it acts as a support level for the price action ahead.
- Dynamic Support and Resistance

Dynamic support and resistance are levels of support and resistance that are based on moving averages or Fibonacci retracements rather than price.
These levels are frequently used as support and resistance, so it is critical to keep them in mind when charting.
Again, higher moving averages, such as the 50-day or 100-day, act as stronger levels of support and resistance.
Advance Study: – Support and Resistance Trading
3.0 Momentum & Volatility in Price Action Trading
Now that you have all of the tools for price action trading, all you need to do is understand momentum and volatility concepts before you start your first winning streak.
Momentum and volatility are used in trading in a variety of ways. Some traders use momentum oscillators to confirm the original price action before entering a trade, while others use volatility to adjust the stop loss point.
However, I would recommend that you go over the fundamental concepts of momentum and volatility and try to gather insights that you can use later in price action trading analysis.
1. Momentum
Momentum simply refers to the rate of change of price in trading. You may have noticed that after a breakout from a trading range, prices tend to move faster with respect to time, and prices with momentum are said to have momentum, and you should always look for prices with momentum to make as much profit as possible during that short period of time when momentum is strong.
One simple way to gauge market momentum is to look at the slope of the trend, which refers to the angle of prices with respect to time; the higher the value, the greater the momentum.
Technical analysts have developed several indicators to check price momentum; not all of them work in every scenario, but the majority of them provide a good indication of price momentum.
Some of the most common momentum indicators are listed below ➖
- MACD indicator
- RSI
- ROC
- ADX
2. Volatility
Volatility, which measures how far a price deviates from its mean statistically, is another important aspect of price action trading.
For price targets, stop losses, and risk management, volatility is crucial.
Without a thorough understanding of volatility, it is impossible to determine the optimal position size and thus volatility plays an important role in all stages of price action trading.
Fortunately for us traders, we don’t need a degree in statistics or mathematics to execute our trades and apply volatility concepts; we have tools to assist us in taking volatility into account.
Here are the list of my favourite set of tools for volatility considerations-
4.0 Price Action Trading Strategies
Now it’s time to get down to business; now that you understand what price action trading is, let’s look at how to make money with it. Like any business in the world to make some bucks you need two things –
- Knowledge of the business
- Strategy to make money out of business
So the first part is covered in all of the preceding sections; if you skipped it, please stop and study it; trust me, there is no shortcut for this one.
Okay, for those who have already covered it, let’s move on to learning price action trading strategies.
We are going to cover four most profitable and easy to implement strategies, there is no end of types of trading strategies so it is worthless to explain every strategy here, if you understand how these four strategies work you can make your own trading strategy as well ( with help of all knowledge you have about price action)
Top 4 Price Action Trading Strategies You can Start Using Today
Most of the price action trading strategies use one or many indicators today, it is hard to find pure price action traders, who only use price for the trading signals, we are also going to use most reliable and time tested tools for our trading strategies, i have listed out four price trading strategies which i have personally find very useful in my short term and long term trading setups-
- Fibonacci Price Action Trading
- Trendlines Trading Strategy
- Moving Average Price Action Trading Strategy
- Trading Price Channels
Click to get the details of each strategy, practice, and back-test them well.
Before we move on to other aspects, let me share some more experience from my vault of trades. You don’t have to make the same rookie mistakes because I’ve covered everything you need to know in the guidelines below.
5.0 Most Important Rule in Price Action Trading
Understanding Probability:– The most important, yet often overlooked, aspect of trading is how to think in terms of probability. Our minds are not wired to think like computers; we have emotions, and we frequently overlook the probability aspect of trading strategy.
To explain this i would now request you to take a coin, a piece of paper and a pen –
Toss the coin and write +1 in paper if it comes up heads, -0.5 in paper if it comes up tails, and so on for at least 20 times.
Consider it as your Profit and loss ( for each head you win 1 dollar and for each trail you loose 0.5 dollars)
How much money have you made from 20 tosses?
Only you can answer it but i am 100% confident that you have a positive result because of the fact that your coin tossing strategy has a probability of 50% and since you only loose 50% of what you earn in each individual toss this becomes your Edge
Its is important to have an edge in trading or any venture for a matter of fact –
“If you don’t have a competitive advantage, don’t compete.”
– Jack Welch
“To trade profitably in the long run, you must know your edge, you must know when it exists, and you must focus your trading to exploit it when you can. If you have no edge, you should not trade for profit. If you know you have no edge, but you must trade for other reasons, you should organize your trading to minimize your losses to those who do have an edge. Recognizing your edge is a prerequisite to predicting whether trading will be profitable.”
–Jessie Livermore
In simple words –
If you understand your price action trading edge, you will eventually find your way to profitable trading; if you don’t have an edge, don’t trade.
6.0 Price Action Trading Books
I’ve done my best to cover a very broad topic in as few words as possible, but if you want to learn everything there is to know about price action trading in greater depth, there are some excellent resources available.
Before we discuss books, let me give you some advice: there is no need for you to learn and remember everything about price action if your goal is only to trade and make money; however, if you are learning price action for the CMT exam, you should read and learn everything.
However, the majority of us are traders, and for traders, price action is about “action” rather than reading and watching about it.
With action-based learning, you will gain more insights, and with a practical trading approach, you can always use books as a reference resource rather than reading everything at once like a scholar.
Now let me give you a list of books you can refer during your price action journey –
- Beginners Price Action Trading Books
| Getting Started in Technical Analysis | Jack D. Schwager |
| Price Action Trading Secrets | Rayner Teo |
| Price Action Breakdown | Laurentiu Damir |
- Intermediate Price Action Trading Books
| The Ultimate Price Action Trading Guide | Atanas Matov |
| New Trader Rich Trader | Steve Burns |
| A Complete Guide To Volume Price Analysis | Anna Coulling |
- Advance Price Action Trading Books
| Trading Price Action Trends | Al Brooks |
| Trading Price Action Trading Ranges | Al Brooks |
| Trading Price Action Reversals | Al Brooks |
Price Action Trading Secrets
Let me give you a secret about price action trading, which was given by Ed. Seykota –
“The biggest secret about success is that there isn’t any big secret about it, or if there is, then it’s a secret from me, too. The idea of searching for some secret for trading success misses the point.”
I was so focused on finding some secret trading strategy during my early trading days that I missed the whole point of trading – I like trading because of its nature, it is undefeated because there is no secret to it, you don’t need to solve the puzzle to make money, you just need to play it efficiently and all money will come to your doorstep.
In other words, don’t let anyone sell you a secret strategy for $1,000 because if it’s a secret strategy, nobody would sell it in the first place for such a small sum.
You won’t need any other secret if you trust the process and your hard work.
Conclusion
There is a lot to learn about price action trading; taking it one day at a time will make life easier, and mastering trading skills takes patience and hard work.
There is no shortcut to success, and trading is no exception. Most profitable traders I know have spent months, if not years, studying price action before placing any bets.
Most successful price action traders like Jesse Livermore, George Soros, Jim Rogers and Richard Dennis have one thing in common i.e Patience
“If most traders would learn to sit on their hands 50 percent of the time, they would make a lot more money.”
Bill Lipschutz
The most difficult thing to learn about trading is when to sit quietly. Most trading mistakes, such as “jumping the gun,” are caused by a lack of patience, so if you want to be a profitable price action trader, you must learn and practice patience.
One last thing i will add here with prime importance is –
Respect Risk Management!
Even if you are correct about a trade, have done all of the analysis thoroughly, and have a strategy with an edge, anything can happen at any time your strategy has not taken into account the unpredictability of the world, natural disasters, economic blunders, or the randomness of future events, so always remember that one trade without proper risk management has the potential to wipe out the entire trading account.
Better risk management is a great trading strategy in and of itself; because of market trends, you will eventually make good money if you haven’t lost too much during random price movements.
Finally my favourite motivational words which I really believe in –
“It was never about the money to make, it was about getting up in the morning and following up the passion , enjoy the challenges and make learning a joyful process, money will be a byproduct off course since trading is a profitable business After All”
Author is Senior Technical Analyst
At Bulls Arena Trading
info@bullsarenatrading
New Delhi
India
Price Action Trading FAQ
How do you trade in price action?
Price action forecasting involves analyzing the historical and current price movement of a specific stock/future contract/currency/crypto and other asset to forecast its future movement.
Does price action work in options trading?
Price action trading works well with all kinds of trading, because basic reasoning behind price move is same irrespective of type of markets.
How to use price action for intraday trading?
Price action trading for intraday is identical in every way except the time frame for analyzing price movement, which is shorter, such as 5 minutes to 1 hour for intraday trading. All chart patterns, trendlines, and candlestick patterns are identical for intraday and swing trading.
Is price action enough?
Price and volume are the two basic elements of price action trading; knowing other aspects such as risk management and trading psychology is sufficient to start trading and making money.
Does price action trading really work?
Price action trading works, as evidenced by the historical performance of price action traders; however, to become a successful price action trader, you must have patience and a trading mindset, which comes with practice and resilience.
More On Price Action Trading
Price action trading is a method of technical analysis that involves analyzing the movement of prices in a financial market, such as the forex market or stock market, to make trading decisions. It is based on the idea that the movement of prices, or “price action,” can provide valuable information about the market and can be used to make informed trading decisions.
One of the key principles of price action trading is the idea that the market is constantly in a state of change and that prices are driven by the forces of supply and demand. By analyzing the movement of prices over time, traders can identify patterns and trends that can help them make more informed decisions about when to enter and exit trades.
One of the advantages of price action trading is that it can be applied to any financial market and to any time frame, from short-term charts to long-term charts. This flexibility makes it a popular choice among traders of all experience levels, from beginners to experts.
To be successful at price action trading, traders need to have a good understanding of technical analysis and be able to read and interpret charts. They also need to be able to identify key support and resistance levels, as well as trend lines and patterns such as head and shoulders, triangles, and wedges.
In addition to these technical skills, traders also need to have strong risk management skills and be able to control their emotions while trading. This is because the market can be volatile and unpredictable, and traders need to be able to handle the ups and downs that come with trading.
Overall, price action trading can be a powerful tool for traders who are willing to put in the time and effort to learn and master the technique. By analyzing the movement of prices and using technical analysis, traders can make more informed decisions and potentially increase their chances of success in the market.
Author