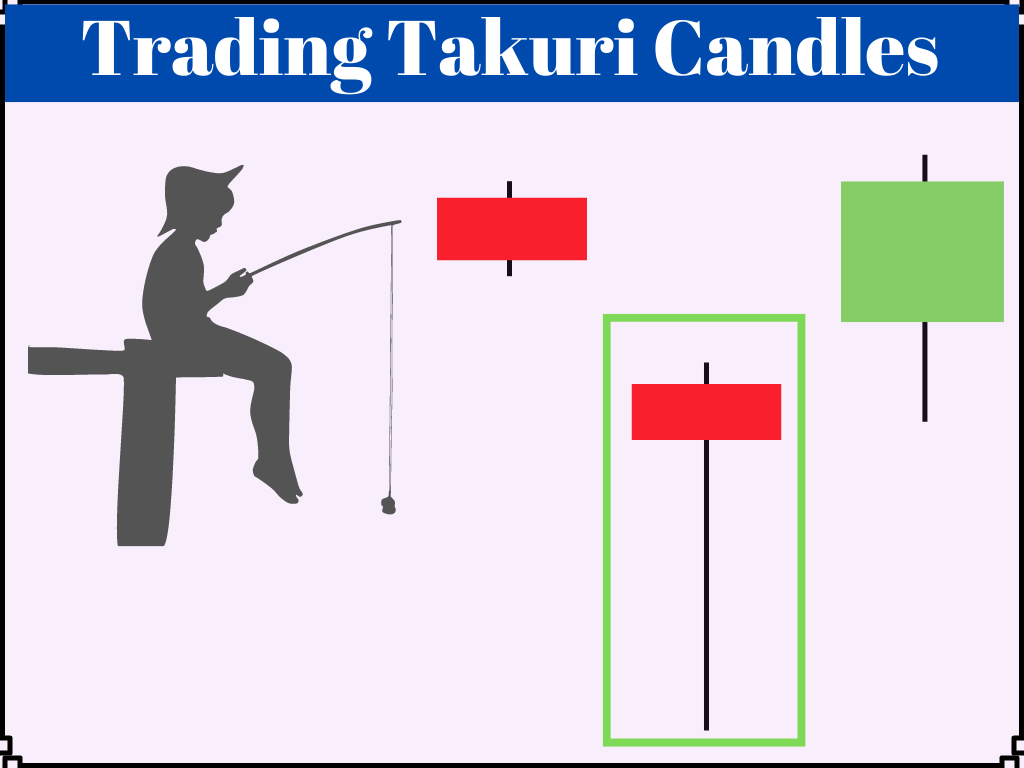
Takuri line is a bullish reversal candlestick pattern with a longer lower shadow than hammer.
Takuri candlestick pattern is a good indicator of reversals in a bear market; its reversal success rate ranges from 60% to 65%.

Takuri, the name of the Takuri pattern is a Japanese word that means “finding the depth of water by feeling its bottom.”
Like hammers, the takuri candlestick pattern is frequent in both bull and bear markets.
In this article, we will look at the significance of the pattern in a downtrend or bear market.
Table of Contents
- Takuri Line Identification
- Psychology behind Takuri line
- Takuri Line Statistics
- Trading Takuri Line Candlestick Pattern
- Best Tips for Trading
- FAQ’S
Takuri Line Identification
The pattern must first be distinguished from hammer to avoid being confused with either.
It is important to note that the color of the candle is not as important as the body and wick. Takuri pattern formation occurs as a result of a very strong reaction from a level, which gives this formation a characteristic deep shadow that is absent in other forms of candlestick patterns.
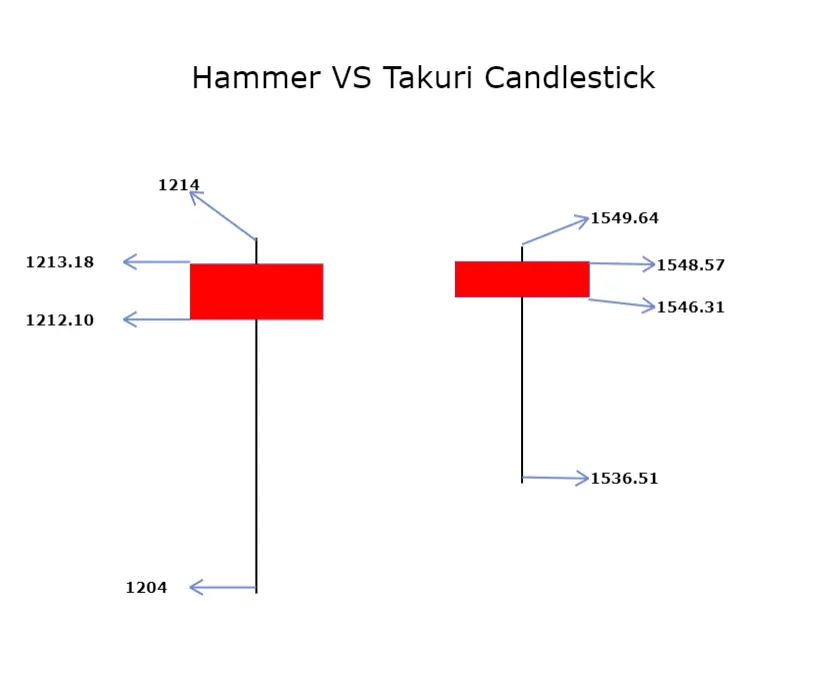
Takuri Line VS Hammer Candlestick Pattern
Takuri candlestick resembles a hammer in appearance, but one of its most distinguishing features is the presence of a longer shadow.
Use the calculation below to distinguish between the shadows of the hammer and the takuri pattern:
Price Reversal % = (Closing Price – Day’s Low) / (Day’s High – Day’s Low)* 100
If the price reversal percentage is less than 80%, the pattern is Hammer.
If the Price Reversal% is greater than 80%, the pattern is Takuri candlestick pattern.
Example –
First candle’s Price Reversal %
= [ (1212.10 – 1204) / (1214 – 1204) ] * 100
=81%
Because the price reversal is greater than 80%, the pattern is designated as the Takuri Line.
For the second candle, Price Reversal %
= [ (1546.31-1536.51) / (1549.64 – 1536.51) ] * 100
= 74.63%
Because the price reversal is less than 80%, the candlestick pattern is a hammer.
To confirm the takuri line candlestick pattern after separating the hammer candlestick from it, use the identification table below.
| Prior Trend | Downtrend ( for bullish reversal) |
| Number of candles to confirm the pattern | One |
| Body | Small candle body |
| Upper shadow | Either not present or very small upper shadow |
| Lower Shadow | Three to four times the height of body |
| Color of body | Doesn’t matter |
Psychology behind Takuri line
Bearish momentum pushes price to an all-time low or a very significant support level, so during the day a very strong bearish candlestick pattern is visible, which may look like a marubozu candle, but at this level some buying is anticipated due to profit booking and an important support level.
This tendency of market participants aids in price recovery because it increases bulls’ confidence when there is a price retracement of more than 50%, which leads to prices closing very close to the day’s opening price.
Takuri candlestick pattern is formed at this point.
Takuri Line Statistics
The table below contains some interesting statistics and numbers for trading the Takuri pattern –
| Bearish Reversal Rate | 65% |
| Breakout Performance | If breakout above pattern sustains for 4-5 candles there is a 80% probability of new upward trend |
| Gap Up Performance | If prices open gap up next day of takuri candle there is a 90% chance of price moving high |
| Lower Shadow | The performance of a bullish reversal is improved by tall lower shadows. |
| Price Reversal % | Higher price reversal % adds up to more reliable trend reversal probability |
| Number of Takuri Formations | Two consecutive or near Takuri candles formation increase the possibility of bullish reversal upto 84% |
Trading Takuri Line Candlestick Pattern
- Examine all markets that are in a downtrend.
- Look for the formation of a Takuri candlestick pattern on the daily candlestick chart and confirm a valid pattern after the market closes using the identification guidelines outlined in the preceding section.
- Wait for the next day’s price action after detecting a valid pattern.
- Use following table to place trades –
| Next Day Price Action | Next Day Volume | Entry | Stop Loss |
| Prices close above the takuri candle’s top. | Higher than takuri line candle formation day | Buy at closing price | Below Takuri line candlestick closing price. |
| Prices gap up | Doesn’t matter | Entry at opening price | Top of Takuri Line candlestick |
| Prices close below the body of takuri line | Doesn’t matter | Wait for 3-4 days for prices to close above takuri line top, enter at closing price | Below the body of the Takuri Line |
- If prices are still trending lower after 4-5 days, the bearish trend will likely continue.
- Target shall be a dynamic trailing stop loss below 1 ATR , since a new trend is a very good opportunity to gain good returns.
Trading Example

The above example depicts the formation of a pattern after a downtrend; it is clear that the lower shadow of the pattern is long enough to qualify as a takuri; the next day, prices not only closed above the pattern but also formed a hammer, which is a bullish reversal formation; this confirmed the entry, and the stop loss is placed just below the body of the takuri formation.
On third day prices sharply move higher and retest the top of hammer candlestick, thereafter a 3.31% up move was witnessed and profit was booked.
One very important aspect of a pattern is good risk to reward, as shown in the above example, the risk-reward ratio = 0.28/3.31( i.e. 1:8)
Best Tips for Trading
- Always double-check that the first weather pattern meets all of the requirements outlined in the identification guidelines.
- Trading volume is important; a candlestick pattern with high volume is a good indicator, and if volume increases the next day, the reliability increases.
- Tall candles perform better than short candles; use the Price Reversal method to determine the height.
- When prices do not immediately rise after the formation of candlestick pattern, wait a few days for price action to build momentum before entering.
- Don’t pass up opportunities presented by gap up openings; usually, if it is a false signal, the market fills the gap in the first session itself; if not, prices have a good chance of moving higher.
Key Takeaways
- Takuri line candlestick pattern is a bullish reversal pattern.
- It has a longer shadow than hammer candlestick pattern.
- In a bear market, the Takuri candles performs very consistently.
- Volume should be used as a supporting indicator when trading with the pattern.
- Sometimes prices stall after pattern formation before eventually moving higher.
- A good long signal is a gap up opening above the pattern.
- Color of the pattern do not matter.
At Bulls Arena Trading
info@bullsarenatrading
New Delhi
India
FAQ’S
What is the Takuri line?
It is a bullish reversal candlestick pattern.
What does the Takuri Line indicate?
Pattern tells us that the downtrend is almost over and there is a possibility of price moving higher.
How to identify the Takuri Line candlestick pattern?
Takuri line candlesticks resemble hammer patterns; however, they can be distinguished from hammer patterns using the price reversal% method.
What is the success rate of the Takuri Line?
It has a success rate of nearly 60 to 65%.
Author