
Candlestick patterns are a vital tool in technical analysis, helping traders decipher market sentiment and make informed decisions. Among these patterns, the Tweezers Candlestick Pattern stands out as a powerful indicator of potential trend reversals or continuations. In this article, we’ll dive deep into this pattern, exploring its types, identification, psychology, trading strategies, and more.
Table of Contents
- What is a Tweezers Candlestick Pattern?
- Types of Tweezers Candlestick Patterns
- Statistical Analysis: Does the Tweezers Candlestick Pattern Work?
- How to Trade Using the Tweezers Candlestick Pattern
- Psychology Behind Tweezers Pattern
- Tweezers Patterns in Different Timeframes
- Common Mistakes To Avoid
- Best Tips For Trading
Tweezers thus represent very short-term levels of support and resistance.
What is a Tweezers Candlestick Pattern?
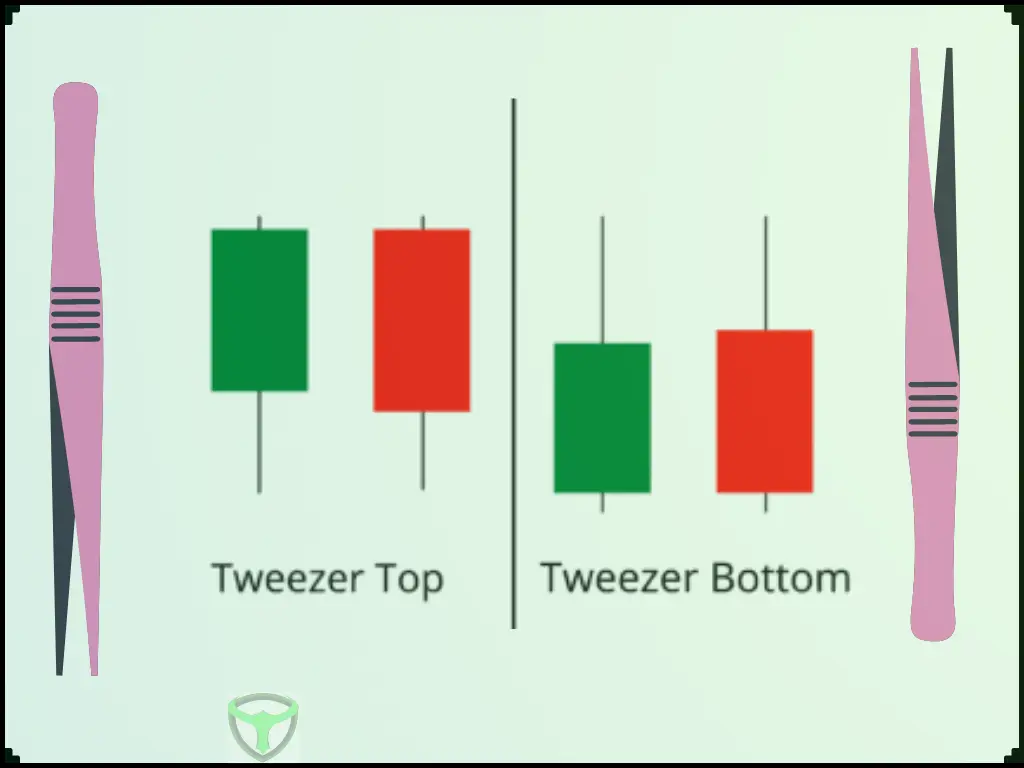
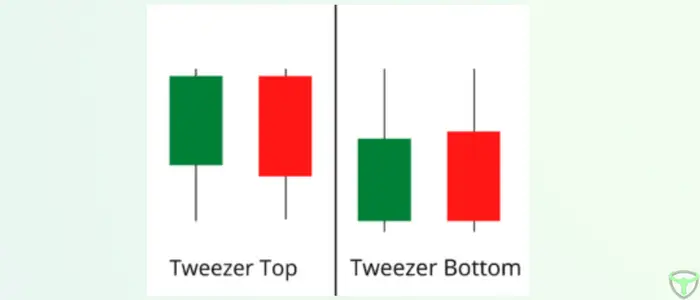
The Tweezers Candlestick Pattern is a powerful indicator of potential trend reversals or continuations. It is characterized by two candlesticks with almost identical highs or lows, forming a pattern that resembles a pair of tweezers. This pattern indicates a shift in market sentiment and is often used by traders to make informed decisions.

Types of Tweezers Candlestick Patterns
There are two primary types of Tweezers Candlestick Patterns:
1. Reversal Tweezers Candlestick Pattern
The reversal Tweezers Candlestick Pattern can signal a change in the current trend. It occurs after a prevailing trend and is characterized by two candlesticks:
- The first candlestick is in the direction of the current trend and has a substantial body.
- The second candlestick is in the opposite direction of the trend and has a small or equal to the first candlestick’s body.
- Both candlesticks have almost identical highs or lows.

This pattern suggests that the market sentiment is shifting, and a reversal might be imminent. Traders often use this pattern as a signal to enter or exit positions.
2. Continuation Tweezers Candlestick Pattern
The continuation Tweezers Candlestick Pattern, on the other hand, signals the continuation of the existing trend. It also consists of two candlesticks:
- The first candlestick is in the direction of the current trend and has a substantial body.
- The second candlestick is also in the same direction as the trend but typically has a smaller body.
- Both candlesticks have almost identical highs or lows.

Traders view this pattern as a confirmation of the prevailing trend, indicating that it is likely to persist.
Statistical Analysis: Does the Tweezers Candlestick Pattern Work?
Now that we’ve covered the basics of the Tweezers Candlestick Pattern, let’s delve into its statistical significance. To determine its effectiveness, a trader should analyse the historical market data and the occurrence of Tweezers Candlestick Patterns.
Bullish Tweezers and Bearish Tweezers
Before we dive into the statistics, it’s essential to distinguish between bullish and bearish Tweezers Candlestick Patterns:
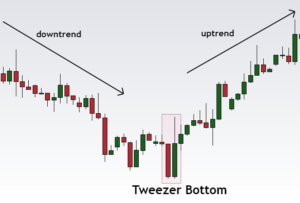
- Bullish Tweezers: This pattern occurs after a downtrend and signals a potential bullish reversal.
| Number of candles | Two |
| Prior Trend | Downtrend |
| Appearance | Two consecutive candles of the same low price |
| Upper Shadows | It doesn’t matter. |
| Color of candles | It makes no difference. |
- Bearish Tweezers: This pattern occurs after an uptrend and signals a potential bearish reversal.

| Number of candles | Two |
| Prior Trend | Uptrend |
| Appearance | Two successive candles with the same high price |
| Upper Shadows | It doesn’t matter. |
| Color of candles | It makes no difference. |
Bullish Tweezers
In our analysis of bullish Tweezers Candlestick Patterns, we found that:
- When a bullish Tweezers pattern forms after a significant downtrend, there is a statistically significant chance of a bullish reversal.
- The accuracy of this pattern is further enhanced when combined with other technical indicators, such as support and resistance levels or trendline analysis.
- Traders often use bullish Tweezers patterns as a signal to enter long positions or exit short positions.
In the example below, Bullish Tweezer pattern, combined with Support zone and RSI (indicating oversold of a price) yielded good returns.

Bearish Tweezers
In our analysis of bearish Tweezers Candlestick Patterns, we found that:
- When a bearish Tweezers pattern forms after a substantial uptrend, there is a statistically significant chance of a bearish reversal.
- Combining the bearish Tweezers pattern with other technical analysis tools and indicators can increase its reliability.
- Traders frequently use bearish Tweezers patterns as a signal to enter short positions or exit long positions.
In this example, we’ve combined Bearish Tweezers pattern with Moving Average Cross and Resistance key level:

How to Trade Using the Tweezers Candlestick Pattern
Now that we’ve established the statistical significance of the Tweezers Candlestick Pattern, let’s discuss how to effectively incorporate it into your trading strategy.
1. Using Tweezers Patterns as Entry Signals
Traders often use Tweezers patterns as entry signals. For instance, when a Bullish Tweezer Bottom appears, it may be an opportune moment to go long, anticipating a bullish trend reversal. Similarly, a Bearish Tweezer Top might prompt a trader to open a short position, expecting a bearish reversal.

Setting Stop-loss and Take-profit Levels
Risk management is vital in trading. Traders should set stop-loss orders just below a Bullish Tweezer Bottom or just above a Bearish Tweezer Top to limit potential losses. Take-profit levels can be set at reasonable points in the anticipated direction of the trend.

Risk Management Considerations
Traders must consider position size and overall risk when using Tweezers patterns. Diversifying a portfolio and not risking more than a set percentage of capital on a single trade can help protect against significant losses.
Psychology Behind Tweezers Pattern
Understanding the psychology behind Tweezers patterns is essential. When a Bullish Tweezer Bottom forms, it implies that after a prolonged downtrend, buyers have stepped in, causing a potential shift in sentiment.
Conversely, a Bearish Tweezer Top suggests that after a strong uptrend, sellers are starting to regain control.
Tweezers Patterns in Different Timeframes
Tweezers patterns hold varying significance in different timeframes. Scalpers may use them for short-term trades, while swing traders may rely on them for medium-term strategies. Understanding the timeframe you’re trading in is crucial.
Scalping Trading Strategy
- Short-Term Entries: Traders who specialize in the M15 timeframe (or less) often use Tweezers Patterns as short-term entry signals.
- Scalping: Scalpers, who thrive on quick trades within minutes, can benefit from Tweezers Patterns on Lower Time Frame charts. They may enter and exit positions rapidly based on these patterns.
- Intraday Confirmation: Traders can use other indicators such as Moving Averages or RSI on LTF charts to confirm Tweezers signals and make more informed decisions.
Here’s an example of scalping M15 timeframe using tweezers pattern:

Swing Trading Strategy
Tweezers Patterns in the D1 timeframe maintain the same characteristics as in shorter timeframes in technical analysis.
- Medium to Long-Term Entries: In the D1 timeframe (or higher), Tweezers Patterns are more suitable for medium to long-term trading. Traders may use these patterns as entry signals for positions that they plan to hold for days, weeks, or even months.
- Position Sizing and Risk Management: Due to the longer time horizon, traders should adjust their position sizes and risk management strategies accordingly. Stops and take-profit levels should be set with consideration of the broader market context.
- Confirmation with Fundamental Analysis: Higher Time Frame Tweezers Patterns can be confirmed with fundamental analysis and macroeconomic factors. Traders often look for alignment between technical signals and the broader economic picture.

Common Mistakes To Avoid
Incorporating Tweezers patterns into trading strategies isn’t without pitfalls. Common mistakes include:
- Overtrading based solely on Tweezers patterns.
- Ignoring other technical indicators.
- Failing to confirm signals with additional analysis.
- Using poor Risk Management strategy.
Best Tips For Trading
- The candle body can be used as a weightage factor for the tweezer top pattern; taller bodies frequently indicate a higher likelihood of reversals.
- Candles with long lower wicks/shadows are also good indicators of trading opportunities with countertrend movement.
- After the pattern is formed, volume can be a good indicator of price action change.
- Market opening gaps can be extremely useful in forecasting the price movement following the pattern.
- Sideways price movement after the pattern is formed can be a 50% chance of either side breakout, wait for the breakout in such cases.
Key Takeaways
- When the tweezers appear in a row, there is a higher likelihood of reversals.
- Swing traders should pay close attention to the price action that occurs immediately after the tweezers candles.
- Tweezer bottoms and tweezer tops both perform better in a bear market than in a bull market.
- Tweezers candlesticks price action, psychology, and working configuration are nearly identical to that of the double bottom and double top chart pattern; both serve as short-term support and resistance levels, with breakouts providing a clear indication of future price movement.
- Combine the tweezers candlesticks with larger time frame chart patterns to get the most out of it.
- Tweezers Patterns maintain their characteristics and significance across different timeframes, but their applications vary.
- From the perspective of multiple trials, the Tweezers Continuation patterns is less likely to occur than the Tweezers Reversal patterns.
Note:-
- To know More about Tweezers you can refer to Thomas N. Bulkowski’s Encyclopedia of Chart Patterns
2. Always conduct thorough research and consider seeking advice from financial professionals before making any investment decisions. This article is for educational purposes only and should not be construed as financial advice.
Frequently Asked Questions
What are Tweezers candlesticks?
Tweezers candlesticks are reversal candlestick patterns formed by two candles
How you trade tweezer top?
If next day of pattern formation candle closes below pattern, it confirms bearish reversal thus place a short trade.
How you trade tweezer bottom?
If next day of pattern formation prices move upwards pattern formation means bullish reversal and hence place long trade.
What does tweezer bottom candlestick mean?
It represents short term support and may act as a bullish reversal pattern.
What does tweezer top candlestick mean?
It represents a short pause in bullish rally, and sometimes if price action follows they act as a bearish reversal patterns.
Suggested Reading :-
- Chart patterns for day trading
- Most Profitable Chart Patterns
- Candlestick Patterns Explained with Examples
- Doji Candlestick Patterns and Double Doji
- Top 10 Candlestick Patterns : Complete Guide
Author


![Read more about the article
<span class="bsf-rt-reading-time"><span class="bsf-rt-display-label" prefix="Reading Time"></span> <span class="bsf-rt-display-time" reading_time="6"></span> <span class="bsf-rt-display-postfix" postfix="mins"></span></span><!-- .bsf-rt-reading-time -->How to Trade Diamond Chart Patterns Like a Pro [2024]](https://bullsarenatrading.com/wp-content/uploads/2022/11/how-to-trade-diamond-pattern-300x169.webp)

