

Are you looking to enhance your trading strategies and maximize your profits? Look no further than the power of “Doji candlestick Patterns”. These patterns have been utilized by seasoned traders for years to identify potential trend reversals and make informed trading decisions.
In this blog, we will explore a highly effective approach to incorporating Doji candlestick patterns into your existing trading strategies or creating entirely new ones.
Table of Contents
- Doji Candlestick Patterns: What is Doji, How to Trade Doji candlestick?
- Interpretation of Doji candlestick patterns
- Importance of Doji candlestick patterns in technical analysis
- Trading strategies using Doji candlestick patterns
- Backtesting and validating Doji candlestick patterns
- Common mistakes to avoid when using Doji candlestick patterns
- Advanced techniques for trading with Doji candlestick patterns
- Conclusion: Harnessing the power of Doji candlestick patterns
- Frequently Asked Questions:
Doji Candlestick Patterns: What is Doji, How to Trade Doji candlestick?
What exactly are Doji candlestick patterns?
They are key indicators displayed on price charts that signify indecision in the market. The pattern forms when the opening and closing prices are very close or even identical, creating a small or no body and a long shadow. This visual representation of market sentiment can provide valuable insights into market direction.

Incorporating Doji candlestick patterns into your trading strategy can help you identify crucial entry and exit points, as well as anticipate market turns before they happen. By understanding the different variations and interpretations of Doji patterns, you can gain an edge in your trading and increase your chances of success.
In this article, we will delve deeper into the power of Doji candlestick patterns and explore how you can use them to enhance your trading strategies. Whether you’re a beginner or an experienced trader, this valuable information will assist you in making more informed and profitable trading decisions. So, let’s get started!
Understanding the Doji candlestick pattern
- Open, Close, High, and Low Prices: A Doji candlestick involves four crucial prices - open (start), close (end), high (peak), and low (lowest point) during a specified time period. When the open and close prices are almost identical, they create a minimal body.

- Doji’s Body and Wicks: The Doji’s body is a thin horizontal line, symbolizing market indecision when open and close prices are close. The vertical wicks above and below the body show the price range. Longer wicks indicate increased price volatility and signify intense battles between buyers and sellers.
The vertical line of a Doji candlestick not only reveals traders’ volatility within a specific time period but also signifies market indecision and diminishing momentum within an ongoing trend, such as when it appears after a prolonged downtrend, indicating waning seller conviction.
Types of Doji candlestick patterns
1. Standard Doji
The standard Doji pattern occurs when the opening and closing prices are equal, creating a small or no body. It represents a market in equilibrium, where neither buyers nor sellers have gained control. This pattern suggests indecision and potential trend reversal.


The above chart shows a price reversal movement after the formation of a typical Doji candlestick at the bottom.
2. Long Legged Doji
The long-legged Doji pattern has an extended shadow on both sides, indicating extreme price volatility during the trading session. It suggests that the market is highly uncertain and can potentially lead to a significant trend reversal.


In this chart, after the pullback, a long-legged Doji indicated the bottom of the pullback, and the market then carried on with its trend.
3. Dragonfly Doji
The dragonfly Doji pattern is characterized by a long lower shadow and little to no upper shadow. It signifies a shift in market sentiment from bearish to bullish, indicating potential trend reversal.
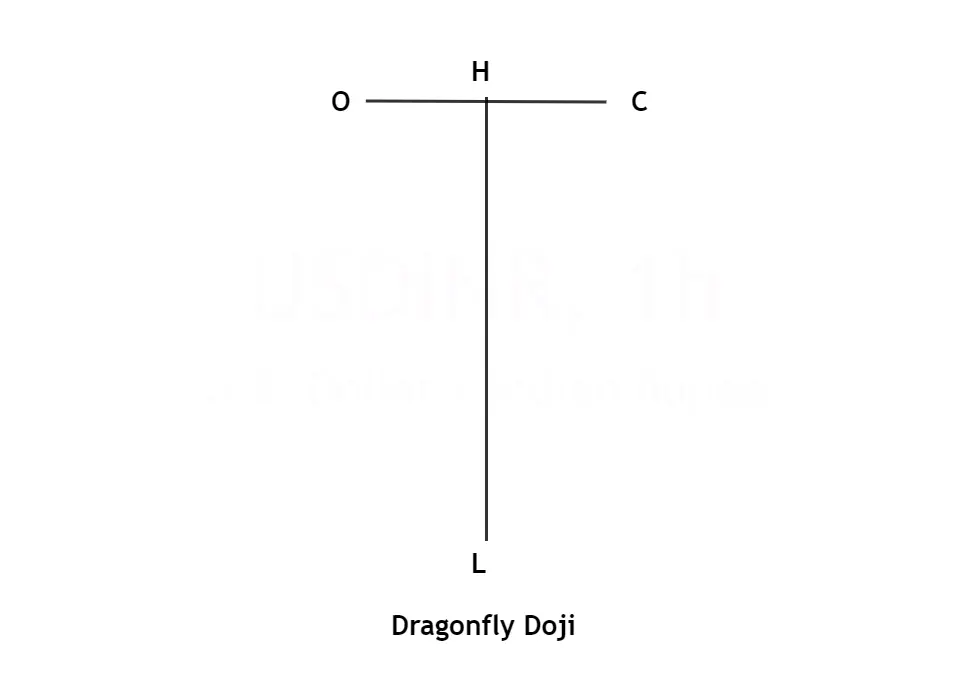

A Dragonfly Doji appears after a downtrend in this chart. A Dragonfly Doji indicates that the bulls’ supremacy entirely diminished the bearish movement as the momentum began to shift upwards.
4. Gravestone Doji
The gravestone Doji pattern is the opposite of the dragonfly Doji. It has a long upper shadow and little to no lower shadow. This pattern suggests a shift in market sentiment from bullish to bearish, indicating potential trend reversal
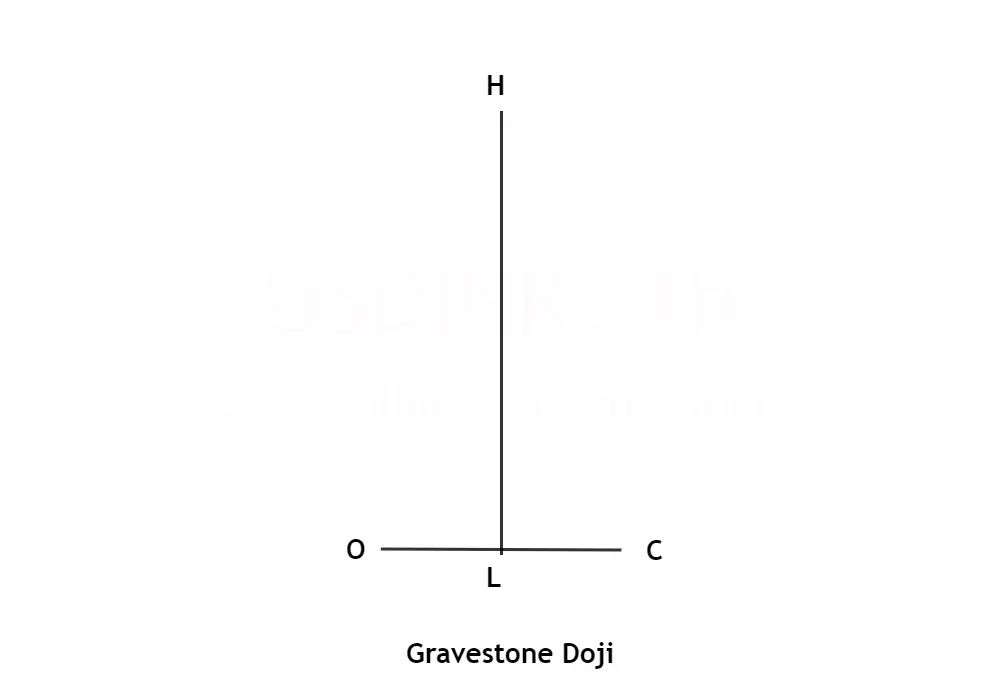

The above price chart displays a Gravestone Doji formation near the uptrend, indicating severe buyers’ exhaustion. Thereafter, bearish candlesticks verified the trend reversal.
5. Four Price Doji
The four-price Doji pattern occurs when the opening, closing, high, and low prices are the same. It represents extreme market indecision and can signal a significant trend reversal.

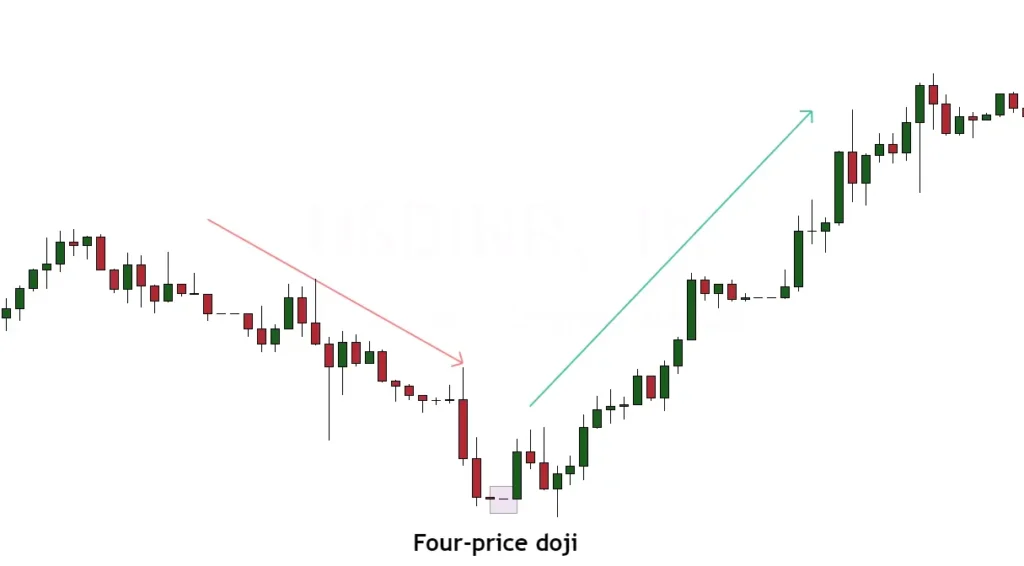
The formation of a Four Price Doji near the bottom, followed by a bullish candlestick, indicated a trend reversal.
Interpretation of Doji candlestick patterns
Interpreting Doji candlestick patterns is essential to making informed trading decisions. While Doji patterns alone may not provide definitive signals, they can offer valuable insights when combined with other technical indicators and chart patterns.
When a Doji pattern forms after a prolonged uptrend, it suggests potential exhaustion and a possible trend reversal. Conversely, a Doji pattern following a downtrend can indicate a weakening bearish momentum and a potential trend reversal to the upside.
The length of the shadows in a Doji pattern also holds significance. Longer shadows indicate increased price volatility and uncertainty, reinforcing the pattern’s potential significance.
Importance of Doji candlestick patterns in technical analysis
Doji candlestick patterns play a crucial role in technical analysis as they provide visual cues of market sentiment and potential trend reversals. By incorporating Doji patterns into your analysis, you can gain a better understanding of market dynamics and make more accurate predictions.
Doji patterns can be used in conjunction with other technical indicators, such as moving averages, trendlines, and support and resistance levels, to confirm trading signals and increase their reliability. When multiple indicators align with a Doji pattern, it strengthens the overall trading signal.
Trading strategies using Doji candlestick patterns
Now that we understand the significance of Doji candlestick patterns, let’s explore some trading strategies that can be implemented to capitalize on their power.
1. Doji Reversal Strategy:
This strategy involves identifying a Doji pattern after a prolonged trend and waiting for confirmation of a trend reversal. Traders can enter a trade when the market breaks the high or low of the Doji candle, depending on the direction of the anticipated reversal.

2. Doji Breakout Strategy:
In this strategy, traders look for a Doji pattern within a consolidation phase or a tight trading range. They anticipate a breakout from the range and enter a trade when the market breaks above or below the high or low of the Doji candle, respectively.

3. Doji Confirmation Strategy:
This strategy combines Doji patterns with other technical indicators, such as moving averages or trendlines. Traders wait for a Doji pattern to form near a significant support or resistance level, and then confirm the signal with a breakout or a reversal pattern.

Backtesting and validating Doji candlestick patterns
Backtesting is an essential step in validating the effectiveness of any trading strategy, including those involving Doji candlestick patterns. By applying historical data to the strategy’s rules and indicators, traders can assess its performance and evaluate its profitability.
To backtest a Doji-based strategy, traders need access to historical price data and a reliable backtesting platform or software. They can define the entry and exit rules based on Doji patterns and other indicators and assess the strategy’s performance over different market conditions and timeframes.
Backtesting helps traders identify the strengths and weaknesses of their strategies and make necessary adjustments to improve their performance. It also provides confidence in the strategy’s ability to generate consistent profits in the live trading environment.
Common mistakes to avoid when using Doji candlestick patterns
While Doji candlestick patterns can be powerful tools in trading, it is important to be aware of common mistakes that traders often make when incorporating them into their strategies.
- Over-reliance on Doji Patterns: Relying solely on Doji patterns without considering other technical indicators or market factors can lead to false signals and poor trading decisions. It is crucial to use Doji patterns in conjunction with other tools to confirm trading signals.
- Ignoring Market Context: Context is key in trading. Failing to consider the overall market conditions, trend direction, and relevant support and resistance levels can result in incorrect interpretation of Doji patterns and ineffective trading strategies.
- Lack of Risk Management: Proper risk management is essential in trading. Failing to set appropriate stop-loss orders or position sizing can lead to significant losses, even when using Doji patterns as trading signals.
- Not Validating Strategies: Backtesting and validating trading strategies are crucial steps in ensuring their effectiveness. Neglecting to thoroughly test and evaluate the performance of Doji-based strategies can lead to unreliable and unprofitable trading decisions.
By avoiding these common mistakes, traders can maximize the potential of Doji candlestick patterns and improve their overall trading success.
Advanced techniques for trading with Doji candlestick patterns
For experienced traders looking to further enhance their trading strategies, here are some advanced techniques that can be employed when using Doji candlestick patterns.
1. Multiple Timeframe Analysis:
Analyzing Doji patterns across multiple timeframes can provide a broader perspective on market sentiment and trend reversals. Confirming a Doji pattern on higher timeframes with the same signal on lower timeframes increases the reliability of the trading signal.
2. Volume Analysis:
Incorporating volume analysis with Doji patterns can provide additional confirmation of the pattern’s significance. An increase in volume during the formation of a Doji pattern suggests higher market participation and strengthens the validity of the potential trend reversal.
3. Candlestick Pattern Combinations:
Combining Doji patterns with other candlestick patterns, such as hammers, shooting stars, or engulfing patterns, can create powerful trading signals. These combinations provide additional confirmation and increase the probability of successful trades.
4. Combining Doji with Other Technical Indicators
A. Moving average crossovers and Doji

B. Relative Strength Index (RSI) and Doji confirmation

C. Fibonacci retracements and Doji clusters
Advanced techniques require a deep understanding of technical analysis and extensive experience in trading. Traders should thoroughly test and validate these techniques before implementing them in live trading.

Conclusion: Harnessing the power of Doji candlestick patterns
Incorporating Doji candlestick patterns into your trading strategy can provide valuable insights into market sentiment and potential trend reversals. By understanding the different variations and interpretations of Doji patterns, you can gain an edge in your trading and increase your chances of success.
Remember to combine Doji patterns with other technical indicators and consider market context for more accurate trading decisions. Backtesting and validating your strategies are crucial steps in ensuring their effectiveness and profitability.
As with any trading approach, it is important to practice proper risk management and avoid common mistakes. By harnessing the power of Doji candlestick patterns and implementing advanced techniques, you can enhance your trading strategies and maximize your profits.
So, take advantage of the power of Doji candlestick patterns and elevate your trading to new heights. Start incorporating them into your analysis and see how they can transform your trading results. Happy trading!
Bonus Read -
How To Use Double Doji Candlestick Patterns?
Frequently Asked Questions:
What are the different types of Doji?
There are several Doji variations. However, Doji formation comes in 5 major types - Standard Doji, Long-legged Doji, Gravestone Doji, Dragonfly Doji, 4 price Doji.
Is Doji candlestick bullish or bearish?
A Doji candlestick is neither bullish nor bearish. It indicates market uncertainty or a pause. It has no real body.
What happens after a Doji Candlestick?
Doji often signals the exhaustion of a previous trend and the emergence of a new trend. Doji candlesticks can also indicate an upcoming market consolidation period.
How to identify Doji?
Doji can easily be identified since its opening and closing prices are the same. There should be no real body. The upper and lower wicks of a Doji represent the highest and lowest prices at which an asset has traded within a certain time period.
What is Dragonfly Doji Candlestick?
u003cbr /u003eIt is a bullish reversal pattern, followed by an uptrend price movement. Its structure is shaped like a u0022Tu0022 and can be used for buying opportunities.
What is Grave Stone Doji Candlestick?
It is a bearish reversal pattern, followed by a downtrend price movement. It is the opposite of Dragonfly Doji and can be used for selling opportunities.
What is Four-Price Doji?
This candlestick indicates extreme indecision since all four of its components (OHLC) remain at the same level.
What does Double Doji Candlestick mean?
A two-candle pattern in which two successive Doji appear. A price reversal or continuation is well indicated by it.
Read also :-
Morning Doji Star Candlestick Pattern
Author


![Read more about the article
<span class="bsf-rt-reading-time"><span class="bsf-rt-display-label" prefix="Reading Time"></span> <span class="bsf-rt-display-time" reading_time="3"></span> <span class="bsf-rt-display-postfix" postfix="mins"></span></span><!-- .bsf-rt-reading-time -->Complete Stomach Pattern ? Best Quick Start Guide [2024]](wp-content/uploads/2022/08/stomach-pattern-300x225.webp)
![Read more about the article
<span class="bsf-rt-reading-time"><span class="bsf-rt-display-label" prefix="Reading Time"></span> <span class="bsf-rt-display-time" reading_time="6"></span> <span class="bsf-rt-display-postfix" postfix="mins"></span></span><!-- .bsf-rt-reading-time -->How to Trade Diamond Chart Patterns Like a Pro [2024]](data:image/svg+xml;base64,PHN2ZyB4bWxucz0iaHR0cDovL3d3dy53My5vcmcvMjAwMC9zdmciIHdpZHRoPSIzMDAiIGhlaWdodD0iMTY5IiB2aWV3Qm94PSIwIDAgMzAwIDE2OSI+PHJlY3Qgd2lkdGg9IjEwMCUiIGhlaWdodD0iMTAwJSIgc3R5bGU9ImZpbGw6I2NmZDRkYjtmaWxsLW9wYWNpdHk6IDAuMTsiLz48L3N2Zz4=)


There is certainly a great deal to find out about this topic. I really like all of the points you have made.