

Welcome to our comprehensive guide on mastering candlestick chart patterns, the key to analyzing stock trends. Whether you’re a seasoned investor or just starting out, understanding these patterns is essential for making informed decisions in the stock market. In this article, we will break down the most common candlestick patterns and explain how to interpret them effectively.
By learning how to read candlestick charts, you can uncover valuable insights into market sentiment and indicate potential trend reversals or continuations. We will teach you how to identify bullish and bearish patterns, such as doji, hammer, engulfing, and shooting star, providing real-life examples to illustrate their significance.
Table of Contents
- Understanding the basics of candlestick charts
- Bullish Candlestick Patterns and Their Meanings
- Bearish candlestick patterns and their meanings
- Reversal candlestick patterns and their significance
- Continuation candlestick patterns and how to spot them
- Using candlestick patterns in technical analysis
- Common mistakes to avoid when analyzing candlestick patterns
- Tools and resources for mastering candlestick chart patterns
- Conclusion: Applying candlestick chart patterns to your trading strategy
- FAQ’s
Our step-by-step guide will equip you with the knowledge to recognize these patterns on your own and apply the information to your trading strategy. Whether you’re using candlestick charts for day trading, swing trading, or long-term investing, this guide will give you an edge in the market.
Join us as we delve into the world of candlestick chart patterns and uncover the secrets of successful trend analysis.
Let’s get started on your journey to master the art of reading candlestick charts and make smarter investment decisions.
Understanding the basics of candlestick charts
Candlestick charts are a popular tool used by traders and investors to analyze stock trends. They provide a visual representation of price movements over a specific period, typically a day, week, or month. Each candlestick on the chart represents the open, high, low, and close prices for that period.
The body of the candlestick is colored, either green or red, to indicate whether the price closed higher or lower than the open. If the price closed higher, the candlestick is usually green, indicating a bullish sentiment. Conversely, if the price closed lower, the candlestick is red, indicating a bearish sentiment.
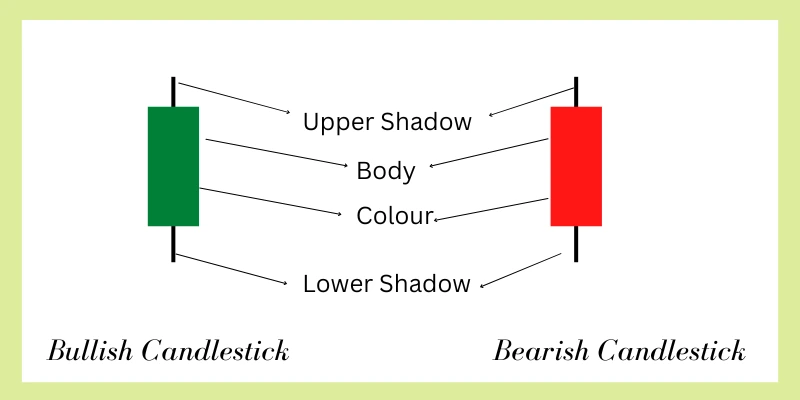
Candlestick charts also include “wicks” or “shadows” that extend from the top and bottom of the candlestick’s body. These represent the highest and lowest prices reached during the period. By analyzing the length and direction of the wicks, traders can gain insights into market volatility and potential price reversals.
Understanding the basics of candlestick charts is crucial before diving into specific patterns. It allows you to interpret the context of each pattern and make more informed trading decisions. Now that you have a solid foundation, let’s explore some of the most common candlestick patterns and their meanings.
Bullish Candlestick Patterns and Their Meanings
Bullish candlestick patterns indicate a potential uptrend in the stock price, suggesting that buyers are in control. These patterns often signal a reversal or continuation of an existing upward trend. Let’s explore some of the most widely recognized bullish patterns and their meanings.
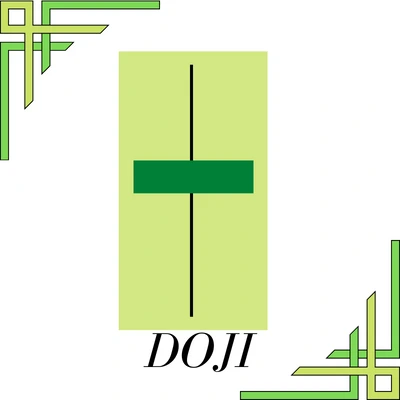
- Doji: A doji is a candlestick pattern with a small body and wicks of equal length, indicating indecision in the market. It suggests that buyers and sellers are evenly matched and can signal a potential trend reversal when it occurs after a downtrend.
- Hammer: The hammer is a bullish reversal pattern that consists of a small body and a long lower wick. It shows that sellers pushed the price lower, but buyers stepped in and drove it back up, indicating a potential trend reversal.

- Engulfing: An engulfing pattern occurs when a bullish candle completely engulfs the previous bearish candle. It suggests a shift in market sentiment from bearish to bullish and can be a strong signal for a trend reversal or continuation.

These are just a few examples of bullish candlestick patterns. Each pattern has its own unique characteristics and significance. By learning to identify these patterns on your candlestick charts, you can gain valuable insights into potential bullish trends and make more informed trading decisions.
Bearish candlestick patterns and their meanings
Bearish candlestick patterns indicate a potential downtrend in the stock price, suggesting that sellers are in control. These patterns often signal a reversal or continuation of an existing downward trend. Let’s explore some of the most widely recognized bearish patterns and their meanings.
- Shooting Star: A shooting star is a bearish reversal pattern characterized by a small body and a long upper wick. It suggests that buyers pushed the price higher during the period, but sellers took control and drove it back down, indicating a potential trend reversal.

- Hanging Man: The hanging man is a bearish reversal pattern that resembles a hammer but occurs at the top of an uptrend. It signals that buyers failed to maintain control, and sellers may be taking over, indicating a potential trend reversal.

- Evening Star: An evening star pattern occurs when a bullish candle is followed by a small body and a bearish candle. It suggests a shift in market sentiment from bullish to bearish and can be a strong signal for a trend reversal or continuation.

These are just a few examples of bearish candlestick patterns. Each pattern has its own unique characteristics and significance. By learning to identify these patterns on your candlestick charts, you can gain valuable insights into potential bearish trends and make more informed trading decisions.
Reversal candlestick patterns and their significance
Reversal candlestick patterns are powerful indicators of potential trend reversals. They provide insights into the change in market sentiment from bullish to bearish or vice versa. Let’s explore some of the most commonly observed reversal patterns and their significance.
- Morning Star: The morning star pattern is a bullish reversal pattern that consists of a bearish candle, a small body, and a bullish candle. It suggests a shift from bearish to bullish sentiment and can signal a potential trend reversal.

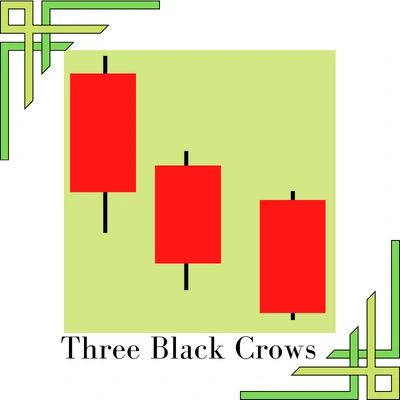
- Three Black Crows: The three black crows pattern is a bearish reversal pattern that consists of three consecutive bearish candles with lower lows. It indicates a shift from bullish to bearish sentiment and can signal a potential trend reversal.
- Piercing Line: The piercing line pattern is a bullish reversal pattern that occurs when a bearish candle is followed by a bullish candle that closes at least halfway up the previous candle’s body. It suggests a potential trend reversal as buyers start to regain control.

These reversal patterns can provide valuable insights into potential trend reversals. By recognizing these patterns on your candlestick charts, you can anticipate changes in market sentiment and make more informed trading decisions.
Continuation candlestick patterns and how to spot them
Continuation candlestick patterns indicate that the current trend is likely to continue. They suggest that buyers or sellers remain in control and that there is a high probability of the trend persisting. Let’s explore some of the most commonly observed continuation patterns and how to spot them.
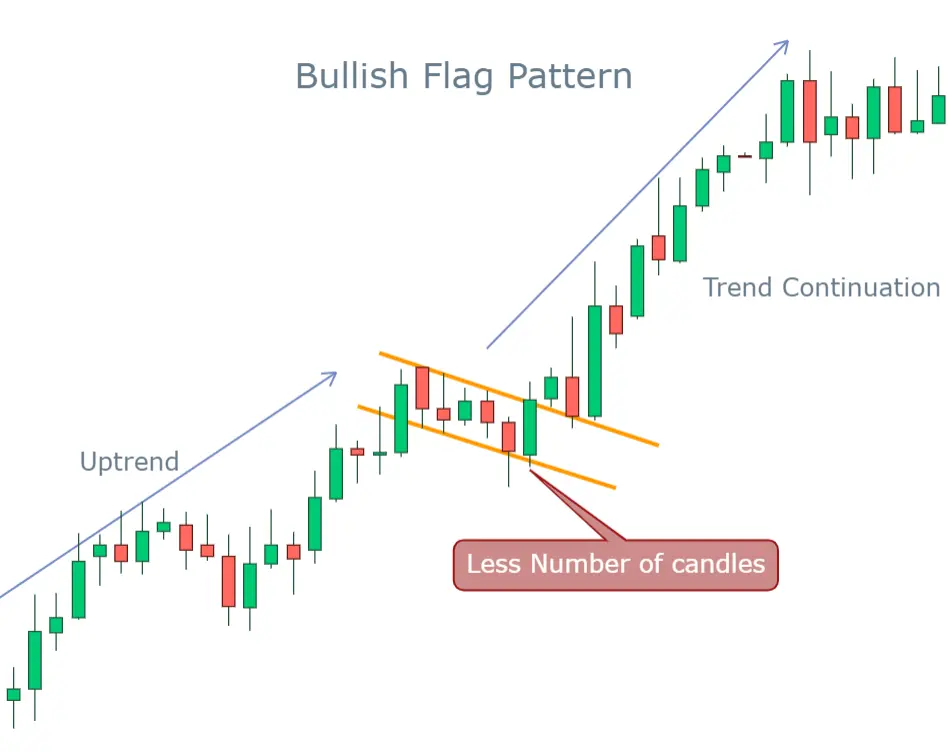
- Bullish Flag: The bullish flag pattern is a continuation pattern that occurs when there is a brief consolidation period after a strong bullish move. It consists of a small rectangular pattern followed by an upward breakout, indicating a continuation of the previous uptrend.
- Bearish Pennant: The bearish pennant pattern is a continuation pattern that occurs when there is a brief consolidation period after a strong bearish move. It consists of a small triangular pattern followed by a downward breakout, indicating a continuation of the previous downtrend.

- Ascending Triangle: The ascending triangle pattern is a bullish continuation pattern that occurs when the price forms higher lows and a horizontal resistance line. It suggests that buyers are in control and that the uptrend is likely to continue once the price breaks above the resistance line.

These continuation patterns can help traders identify potential opportunities to enter or add to existing positions in the direction of the prevailing trend. By recognizing these patterns on your candlestick charts, you can make more informed trading decisions and ride the momentum of the market.
Using candlestick patterns in technical analysis
Candlestick patterns are a valuable tool in technical analysis, allowing traders to analyze market sentiment and make informed trading decisions. When combined with other technical indicators, such as trendlines, moving averages, and volume, candlestick patterns can provide a comprehensive picture of the market.
For example, if a bullish candlestick pattern forms near a key support level, it can indicate a potential bounce and act as confirmation for a long position. Conversely, if a bearish candlestick pattern forms near a key resistance level, it can indicate a potential reversal and act as confirmation for a short position.
It’s important to note that candlestick patterns should not be used in isolation but in conjunction with other technical analysis tools. By considering multiple factors and confirming signals from different indicators, traders can increase the probability of successful trades and reduce the risk of false signals.
Common mistakes to avoid when analyzing candlestick patterns
While candlestick patterns can provide valuable insights into market sentiment, it’s important to avoid common mistakes that can lead to inaccurate interpretations. Here are some mistakes to avoid when analyzing candlestick patterns:
- Taking patterns out of context: It’s crucial to consider the overall market context when analyzing candlestick patterns. A pattern that appears bullish in isolation may be insignificant or even bearish in a down trending market.
- Ignoring volume: Volume can provide confirmation or divergence signals when analyzing candlestick patterns. High volume during a pattern’s formation can increase its significance, while low volume may indicate a lack of conviction.
- Overcomplicating analysis: It’s easy to get overwhelmed by the multitude of candlestick patterns. Instead of trying to memorize every pattern, focus on a few key patterns that have proven to be reliable in your trading strategy.
By being aware of these common mistakes, you can enhance the accuracy of your candlestick pattern analysis and make more informed trading decisions.
Tools and resources for mastering candlestick chart patterns
Mastering candlestick chart patterns requires practice and continuous learning. Fortunately, there are several tools and resources available to help you improve your skills. Here are a few recommendations:
1. Educational websites: Many websites offer free educational content on candlestick chart patterns, including tutorials, articles, and videos. Take advantage of these resources to deepen your understanding and stay updated on new patterns and techniques.
2. Trading platforms: Most trading platforms provide candlestick charts and technical analysis tools. Explore the features and functionalities of your trading platform to access real-time charts, pattern recognition tools, and customizable indicators.
Example :- candlestick patterns screener provided by TradingView.
3. Books: There are numerous books dedicated to candlestick chart patterns and their applications in technical analysis. Some highly recommended titles include “Japanese Candlestick Charting Techniques” by Steve Nison and “Candlestick Charting Explained” by Gregory L. Morris.
By utilizing these tools and resources, you can enhance your knowledge and proficiency in analyzing candlestick chart patterns.
Conclusion: Applying candlestick chart patterns to your trading strategy
In conclusion, mastering candlestick chart patterns is a valuable skill for analyzing stock trends and making informed trading decisions. By understanding the basics of candlestick charts and learning to interpret bullish, bearish, reversal, and continuation patterns, you can gain valuable insights into market sentiment and identify potential opportunities.
Remember to use candlestick patterns in conjunction with other technical analysis tools and avoid common mistakes to ensure accurate interpretations. Continuously practice and explore additional resources to deepen your knowledge and refine your trading strategy.
Now that you have a comprehensive guide on mastering candlestick chart patterns, it’s time to apply what you’ve learned and embark on your journey to become a successful trader. Happy trading!
Writer’s Notes-
The above blog article is a comprehensive guide on mastering candlestick chart patterns, providing insights into the basics of candlestick charts, bullish and bearish candlestick patterns, reversal and continuation patterns, technical analysis, common mistakes to avoid, and tools and resources for further learning. The article aims to equip readers with the knowledge and skills to effectively analyze stock trends using candlestick chart patterns, helping them make informed trading decisions.
FAQ’s
Q1: What are candlestick chart patterns, and why are they important in trading?
Candlestick chart patterns are graphical representations of price movements in financial markets. They are essential in trading because they provide valuable insights into market sentiment, helping traders make informed decisions.
Q2: Are candlestick patterns suitable for all types of traders?
Yes, candlestick patterns are versatile and can be used by day traders, swing traders, and long-term investors. The choice of pattern and strategy depends on the trader’s goals and time horizon.
Q3:How can I identify candlestick patterns on a price chart?
To identify candlestick patterns, you need to learn the characteristics of each pattern and recognize them visually on price charts. Education and practice are key to developing this skill.
Q4: Do candlestick patterns guarantee success in trading?
While candlestick patterns provide valuable insights, they do not guarantee success. They should be used in conjunction with other technical analysis tools and risk management strategies for more reliable trading decisions.
Q5: Can candlestick patterns be used in combination with other technical indicators?
Yes, many traders combine candlestick patterns with technical indicators like moving averages, RSI, or MACD to increase the reliability of their trading signals.
Author


![Read more about the article
<span class="bsf-rt-reading-time"><span class="bsf-rt-display-label" prefix="Reading Time"></span> <span class="bsf-rt-display-time" reading_time="4"></span> <span class="bsf-rt-display-postfix" postfix="mins"></span></span><!-- .bsf-rt-reading-time -->What is Technical Analysis [ TOP 3 Eye-Opening Secrets Revealed]](https://bullsarenatrading.com/wp-content/uploads/2022/07/Optimized-what-is-technical-analysis-300x225.jpg)

