

Candlestick charts for day trading, swing trading, and scalping ( see types of trading ) are analyzed in different time frames.
If you can read candlesticks and the price action associated with them, you can really have an edge and become a successful intraday trader. In this blog, I will show you how to use candlestick charts in combination with other tools such as support and resistance, moving averages, and Fibonacci retracements to determine the best entry and exit points.
Table of Contents
- What is intraday trading?
- What exactly are candlestick charts?
- How To Read Candlestick Charts For Day Trading:
- Using Candlestick Charts for day trading
- Conclusion

Along with best candlestick charts for day trading we will also learn how to use risk management in candlestick charts.
Risk management should be of prime importance for any type of trading, and we will evaluate and explain how to read candlestick charts for day trading along with risk management prospective.
What is intraday trading?
Intraday, or day trading, refers to buying and selling an asset within a single day. These assets include stocks, commodities, currencies, bonds, and securities, to name a few.
Intraday price changes are especially important for traders who plan to open long (buy) or short (sell) positions when the market opens and close all positions before the end of the trading day.
A trader’s primary objective is to go long (buy) at a low price, or go short (sell) at a high price, and close it within a day. Price fluctuations are frequently influenced by supply and demand, momentum, and volatility.
Common timeframes that are used for intraday trading:
Traders use short time frames to pay close attention to price swings in an attempt to profit from price changes. Time period charts that are most often used for intraday trading are:
- 60-minute time frame
- 30-minute time frame
- 15-minute time frame
- 5-minute time frame
An intraday trader’s basic objective is to analyze market structure using a time frame such as 60 minutes or 15 minutes, depending on their convenience, to identify crucial key levels that may offer buying or selling opportunities.
And by choosing such time frames, a trader hopes to use technical tools, such as candlestick chart patterns, as well as other technical indicators, to forecast future price moves.
What exactly are candlestick charts?
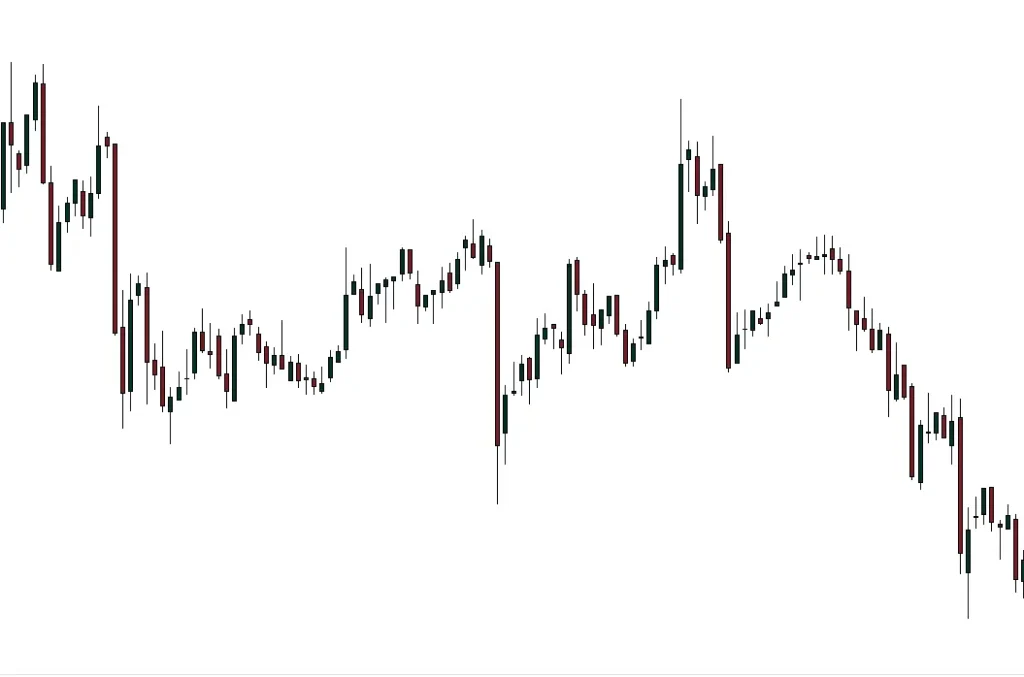
A candlestick chart is a trading tool for understanding price activity that is made up of individual candles. The open, high, low, and close prices serve as the foundation for the candlestick’s elements.
A candle’s close, whether below or above its open, implies further action of price. A typical candle structure on a candlestick chart is seen in the figure below.
How To Read Candlestick Charts For Day Trading:
Candlestick charts can be interpreted in a variety of ways. Traders use different periods to analyze market behavior based on their trading approach. Each candlestick has a unique interpretation that reflects the market’s sentiment.
The bodies of candlesticks can be long or short. Strong buying or selling is indicated by the long body. The longer the body, the higher the pressure of buyers or sellers and the further the distance between the close and the open.
A short body reflects weak buying or selling activity.

Single candlestick patterns
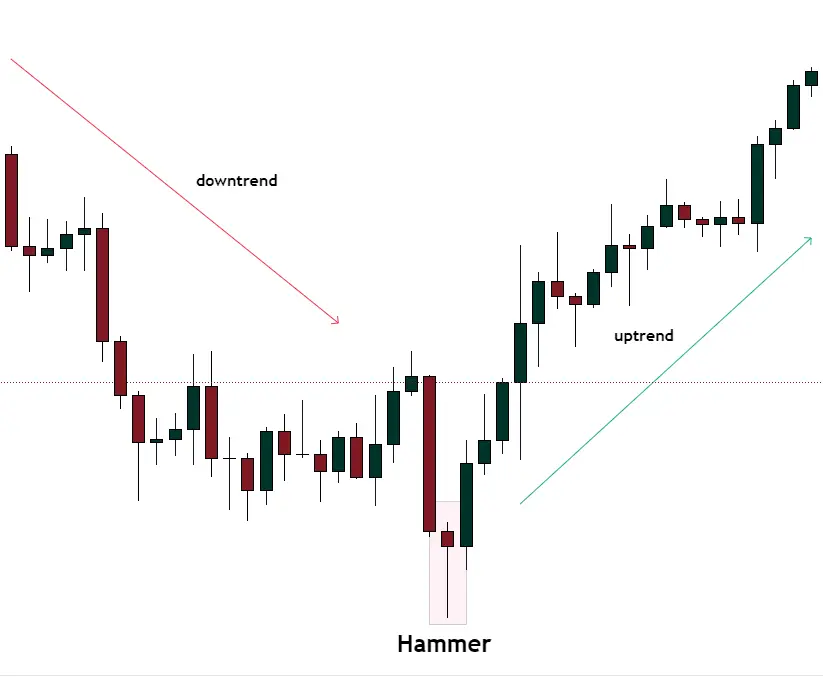
Candlestick formations such as the hammer, shooting star, and spinning top signal when a trend is about to reverse. These candlesticks inform traders about who is about to take possession and who is about to run out of steam. As shown in the example below, when a hammer forms, bulls enter the market and use momentum to reverse the price.
Multiple candlestick patterns
A trader may take advantage of bullish engulfing patterns, bearish engulfing patterns, morning stars, and evening stars by recognizing them and determining entry or exit signals.
For example, the image below shows a morning star pattern, which is made up of three candlesticks. It indicates trend weakness and a bullish turnaround. A trader would profit from this pattern by placing a long position immediately after this formation. Remember, the price pattern only appears after the candle closes.

Check out [Top 10 candlesticks for trading] for additional information on different candlestick patterns and how to recognize them. A trader may benefit from spotting distinct candlestick patterns in order to find favorable opportunities for buying or selling in the market.
Using Candlestick Charts for day trading
Candlestick patterns, when used with other price action and technical tools, including Support and Resistance, Fibonacci Retracement Tool, and Moving Averages, can assist a trader to identify potential entry points for additional confirmation.
Because intraday trading is very volatile, a trader must consider several aspects before placing an entry. Just because a candlestick pattern predicts a reversal or continuation doesn’t guarantee it will occur every time. Pay close attention to the market conditions and what price action is intending to tell you.
1. Candlestick Chart Patterns with Support and Resistance
Combining candlestick patterns with support and resistance levels allows a trader to identify key levels for analyzing price activity. Here is an illustration:

In this figure, a resistance zone was formed near the 16,307 level on a 15-minute candlestick chart. After making a swing low, the price retraced towards the zone and re-tested it. A proper engulfing candle formed in the resistance zone, signaling a probable bearish reversal.

Using these two confirmations, the price then reversed and proceeded in a bearish trend.
How to manage Risk:
Managing risk in intraday trading can be tricky. The level of risk that traders are willing to take varies. However, it is supposed to keep a stop loss order beyond the candlestick pattern’s body or wick (if any).
Set your stop loss below the candlestick pattern and support level for a long entry.
Set your stop loss above the candlestick pattern and resistance level for a short entry.
This is because if the price reversed and create a new candlestick that closed beyond our candlestick pattern and key level, the reversal signal would no longer be regarded valid.
2. Candlestick Chart Patterns with Moving Average
A moving average is a trend-following technical indicator that traders frequently use to anticipate the direction of an asset. It is calculated using the last “X” number of periods. A 25-period moving average on a 1-hour chart, for instance, computes the average of the previous 25 candlesticks using their closing price.
Using moving average along with candlestick charts for day trading can prove to be a much better system.
The moving average acts as a dynamic Support and Resistance level on a candlestick chart. Moving Averages are frequently used as key areas by intraday traders. If the price tests this dynamic level and displays a Reversal candlestick pattern, such as a spinning top or an engulfing pattern, it would serve as a nice entry opportunity.
Until the moving average is broken, a price above it indicates a buying opportunity. Similarly, if the price remains below the moving average, a selling opportunity may present itself.
Examine this 15-minute candlestick chart. The level of the moving average is set at 25. As you can see, the trend has shifted downwards after a moving average breakthrough on July 10th. Because the market is in a bearish state, a trader should aim to enter short positions after the price retests the dynamic resistance level and forms a price action.

Price tested the level again a few hours after the breakthrough, provide good shorting possibilities.
How to Manage Risk:
When buying, set your stop loss below the moving average line or a wick.
Place your stop loss above the moving average line or a wick when you are short selling.
3. Using Candlestick Chart Patterns with Fibonacci Retracement:
The Fibonacci tool aids a trader in identifying upcoming support or resistance at the following retracement levels: 23.6%, 38.2%, 50%, 61.8%, and 78.6%. You must locate recent high or low points on your candlestick chart in order to apply the Fibonacci level.
When we use Japanese Candlesticks in conjunction with the Fibonacci Retracement tool, we look for the price action on Fibonacci levels that would indicate the exhaustion of a current trend.
If a candlestick pattern forms near any of these retracement levels, it can give a clue of further trend continuation.
Here is a 15-minute chart of Crude Oil:

The market began to pullback after we defined our high and low points, and it eventually stopped near the 0.618 level. A bullish engulfing pattern emerged, indicating a bullish reversal indication.

Selling pressure was entirely absorbed, and buyers took control and resumed the uptrend.
How to manage risk:
In addition to offering entry points, the Fibonacci Retracement tool can also be used to minimize risk. In general, there are two ways to set your stop loss while using this tool:
Set your Stop Loss beyond preceding Fibonacci level:
Assuming you plan to enter at the 50% Fibonacci level, you should set your stop loss beyond the 61.8% level. This is applicable to long positions.
For short positions, if you plan to enter at the 50% Fibonacci level, you should set your stop loss beyond the 38.2% level.
Set your Stop Loss past the most recent high or low:
For buying entry, you would set your stop loss below the swing low level, recently formed.
For selling situation, stop loss levels above the recent swing high level would be used.
[Suggested Reading : Option Trading Chart Patterns]
Conclusion
- Candlestick charts for day trading is the best charting tool so far.
- By identifying reversal and continuation patterns on candlestick charts, a trader can identify potential key levels for upcoming trading opportunities.
- Candlesticks are not sufficient on their own. Because intraday charts are filled with volatility and fake out movements, a trader must use additional tools to reduce market complexity.
- Rather than focusing on every candlestick pattern, try to focus on candlestick chart patterns that are forming near important levels, such as Support and Resistance.
- Before taking a candlestick charts for day trading into consideration, wait for the candlestick to completely close and wait for further confirmation.
- Control your risks to avoid massive losses. A good way to reduce risks while trading is to use stop losses. For using candlestick charts for day trading, it is recommended that you risk no more than 1% of your initial capital.
At Bulls Arena Trading
info@bullsarenatrading
New Delhi
India
Author


![Read more about the article
<span class="bsf-rt-reading-time"><span class="bsf-rt-display-label" prefix="Reading Time"></span> <span class="bsf-rt-display-time" reading_time="5"></span> <span class="bsf-rt-display-postfix" postfix="mins"></span></span><!-- .bsf-rt-reading-time -->Horn Chart Patterns – Useful Profitable Bar Patterns [2024]](https://bullsarenatrading.com/wp-content/uploads/2022/08/Horn-chart-patterns-Detailed-Trading-Guide-300x225.webp)

