

Triple Tops and Bottoms are reversal chart patterns, signaling a potential trend change in the market. They are called ‘triple’ because they consist of three distinct peaks or valleys on the price chart. These patterns can be seen in various time frames, from intraday charts to monthly charts, making them versatile for different trading styles.
Table of Contents
- Triple Tops Explained
- Triple Bottoms Explained
- Identifying Triple Tops and Bottoms
- Real-World Examples
- Comparing Triple Tops and Bottoms with Double Tops and Bottoms
- Conclusion
- FAQ’S

Triple Tops Explained
Triple Tops occur after an uptrend and represent a significant resistance level that the asset struggles to break through three times. These patterns are seen as a bearish signal, suggesting that the price may reverse and start a downtrend.

Triple Bottoms Explained
On the flip side, Triple Bottoms appear after a downtrend and signify strong support at a particular price level, which the asset tests three times without breaking lower. This pattern is considered bullish, indicating a potential trend reversal to the upside.

Identifying Triple Tops and Bottoms
Identifying a Triple Tops and Bottoms pattern is the first step toward mastering it. Let’s explore how to recognize these patterns with precision.
Triple Tops:
- Three Peaks: Look for three consecutive peaks of nearly equal highs, separated by minor price fluctuations, in an uptrend.
- Horizontal Resistance Line: Draw a horizontal line connecting the highs of the three peaks. This line represents a strong resistance level that the price has failed to break through three times.

Triple Bottoms:
- Three Valleys: Search for three consecutive valleys with nearly equal lows, separated by minor price fluctuations, in a downtrend.
- Horizontal Support Line: Draw a horizontal line connecting the lows of the three valleys. This line represents a formidable support level that the price has failed to breach three times.

Real-World Examples
Triple Top Pattern in Bajaj Finance Ltd (BAJFINANCE) Stock:
Identification:
- First Peak (Left Peak): In the example, we can see the first peak occurring in 6 October 2023. The stock price reached a high of approximately 8192.00. This high was followed by a correction, where the price retreated slightly.

- Second Peak (Middle Peak): The second peak, occurring in 10 October 2023, saw the stock price reaching approximately 8173.00. This high was again followed by a correction, creating a horizontal resistance level when you draw a line connecting the first two peaks.
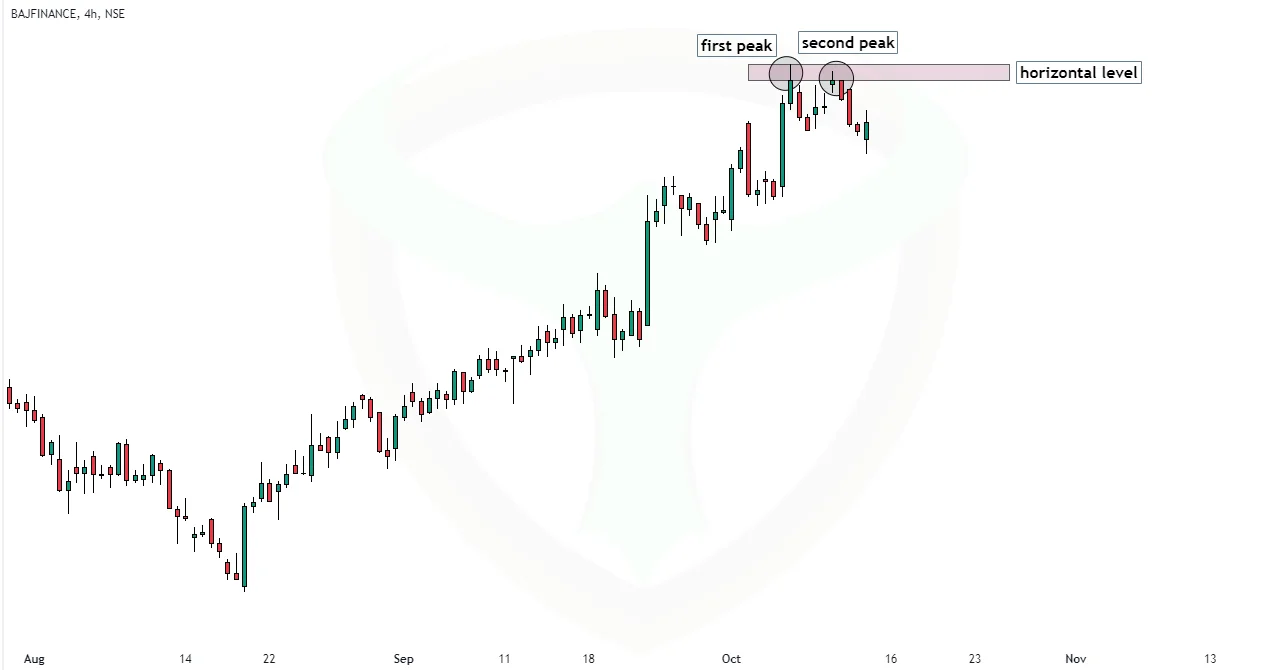
- Third Peak (Right Peak): The third peak occurred in August 16 October 2023, with the stock price reaching around 8159.00. Once again, a correction followed, failing to break through the established resistance level.

Entry and Exit Points with Risk Management:
Traders looking to take advantage of the Triple Top pattern in BAJFINANCE stock might consider the following:
- Entry Point: A potential entry point could be when the stock price breaks below the support level, which is the line connecting the lows between the peaks. In this case, a trader may decide to enter a short position when the stock’s price drops below the support line, which confirmed the Triple Top pattern.

- Exit Points: To set profit targets and manage risks, traders often consider support and resistance levels beyond the pattern. For example, setting a profit target slightly above the next support level or using technical indicators to gauge potential price reversals. The pattern’s height can also be used to set profit target.

- Risk Management: Implementing a stop-loss order just above the resistance line can help limit potential losses in case the trade doesn’t go as planned.

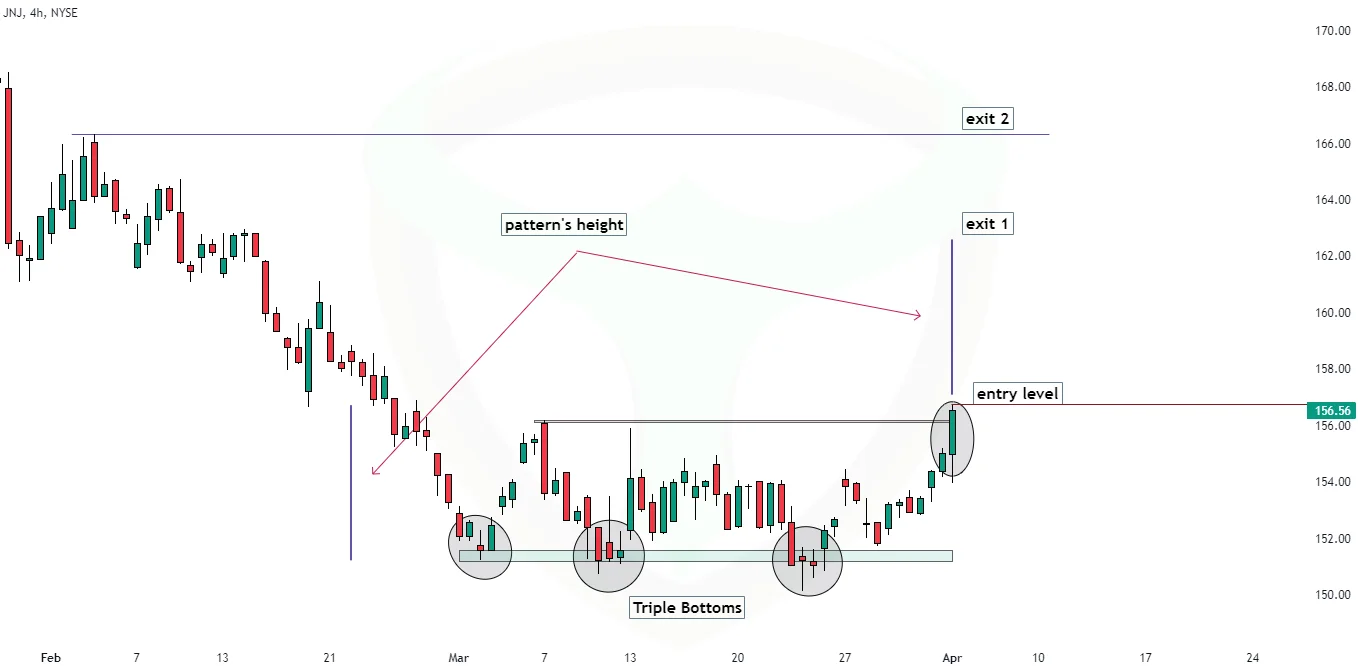
Triple Bottom Pattern in Johnson & Johnson (JNJ Inc.) Stock:
Identification:
- First Valley (Left Valley): The first valley occurred in 2 March 2023 when the stock price reached a low of approximately $151.24.

- Second Valley (Middle Valley): The second valley took place in 9 March 2023, with the stock price hitting a low near $150.74. Connecting the lows from the first two valleys establishes a horizontal support line.

- Third Valley (Right Valley): The third valley was formed in early 23 March 2023, as the stock price dropped to around $150.12, failing to break the established support level.

Entry and Exit Points with Risk Management:
For traders looking to take advantage of the Triple Bottom pattern in JNJ stock:
- Entry Point: A potential entry point could be when the stock price breaks above the resistance level, which is the line connecting the highs between the valleys. Traders may decide to enter a long position when the stock’s price rises above this resistance line, confirming the Triple Bottom pattern.

- Exit Points: Similar to the Triple Top pattern, traders may set profit targets above the next resistance level or use the pattern’s height to identify potential target.
- Risk Management: Implementing a stop-loss order just below the horizontal support line can help manage potential losses if the trade goes against expectations.

Comparing Triple Tops and Bottoms with Double Tops and Bottoms
To gain a deeper understanding of Triple Tops and Bottoms, it’s valuable to compare them with another common pattern: Double Tops and Bottoms.
Double Tops and Bottoms:
Double Tops and Double Bottoms are similar to their triple counterparts but consist of only two peaks or valleys. They are generally considered weaker signals than Triple Tops and Bottoms.
- Double Tops: Typically indicate a potential trend reversal from an uptrend to a downtrend.
- Double Bottoms: Suggest a potential trend reversal from a downtrend to an uptrend.
Here’s a brief comparison table of these patterns:
| Pattern Type | Number of Peaks/Valleys | Strength | Reversal Direction |
|---|---|---|---|
| Triple Tops/Bottoms | Three | Strong | Reversal |
| Double Tops/Bottoms | Two | Weaker | Reversal |
Triple Tops and Bottoms are considered stronger signals because they require more market participants to validate the pattern. The presence of the third peak or valley adds to the pattern’s reliability.
Conclusion
Recap of Triple Tops and Bottoms
In conclusion, Triple Tops and Bottoms are significant chart patterns that traders can use to identify potential trend reversals.
The Art of Chart Pattern Recognition
Mastering the art of recognizing these patterns takes time and practice, but it can be a valuable skill for traders.
Improve Your Trading Skills
Continuously improving your trading skills and knowledge is essential for success in the financial markets. Chart patterns like Triple Tops and Bottoms are just one piece of the puzzle, but they can make a substantial difference in your trading journey.
Intrested to know about statistical analysis of Triple Top & Triple Bottom Pattern ? I would recommnd you to check https://thepatternsite.com/tb.html
FAQ’S
What is the triple top-bottom pattern?
The triple top-bottom pattern is a chart pattern used in technical analysis to identify potential trend reversals.
Is the triple top pattern bullish or bearish?
The triple top pattern is considered bearish, indicating a potential price decline.
How strong is the triple top and bottom pattern?
The triple top and bottom pattern is relatively strong as a reversal indicator, but its effectiveness may vary.
What are the rules for the triple top and bottom pattern?
The pattern is identified by three peaks or troughs at roughly the same price level.
Is the triple top and bottom pattern a reversal pattern?
Yes, it’s primarily a reversal pattern, signaling a potential change in the prevailing trend.
How accurate is the triple top and bottom pattern in technical analysis?
The accuracy of the pattern can vary, and it’s not infallible, but it’s a widely recognized tool in technical analysis.
What sets triple tops and bottoms apart from other patterns?
Triple tops and bottoms are characterized by three distinct price levels that act as resistance or support.
Does the triple top and bottom pattern work in all markets?
The pattern can be applied in various financial markets, but its effectiveness may differ.
Can the triple top and bottom pattern be used for continuation signals?
While primarily a reversal pattern, it may occasionally provide signals for trend continuation in some cases.
Author


![Read more about the article
<span class="bsf-rt-reading-time"><span class="bsf-rt-display-label" prefix="Reading Time"></span> <span class="bsf-rt-display-time" reading_time="5"></span> <span class="bsf-rt-display-postfix" postfix="mins"></span></span><!-- .bsf-rt-reading-time -->Horn Chart Patterns – Useful Profitable Bar Patterns [2024]](https://bullsarenatrading.com/wp-content/uploads/2022/08/Horn-chart-patterns-Detailed-Trading-Guide-300x225.webp)


